Abstract
-
Background
- The objective of this study was to evaluate the usefulness of the newest version of the pediatric index of mortality (PIM) 3 for predicting mortality and validating PIM 3 in Korean children admitted to a single intensive care unit (ICU).
-
Methods
- We enrolled children at least 1 month old but less than 18 years of age who were admitted to the medical ICU between March 2009 and February 2015. Performances of the pediatric risk of mortality (PRISM) III, PIM 2, and PIM 3 were evaluated by assessing the area under the receiver operating characteristic (ROC) curve, conducting the Hosmer-Lemeshow test, and calculating the standardized mortality ratio (SMR).
-
Results
- In total, 503 children were enrolled; the areas under the ROC curve for PRISM III, PIM 2, and PIM 3 were 0.775, 0.796, and 0.826, respectively. The area under the ROC curve was significantly greater for PIM 3 than for PIM 2 (P<0.001) and PRISM III (P=0.016). There were no significant differences in the Hosmer-Lemeshow test results for PRISM III (P=0.498), PIM 2 (P=0.249), and PIM 3 (P=0.337). The SMR calculated using PIM 3 (1.11) was closer to 1 than PIM 2 (0.84).
-
Conclusions
- PIM 3 showed better prediction of the risk of mortality than PIM 2 for the Korean pediatric population admitted in the ICU.
-
Keywords: intensive care units; mortality; pediatrics; prognosis
INTRODUCTION
For advancement in pediatric critical care medicine, the precise prediction of survival is considered imperative [1]. However, there are many challenges in pediatric survival prediction [2,3]. For example, accurate assessment of consciousness in nonverbal children is limited [4], and normal ranges of blood pressure and physiological parameters for children will depend on their age, weight, and height [5]. In addition, there is difficulty in performing invasive procedures to measure prediction parameters.
Since the early 1980s, various scoring systems have been used in pediatric intensive care units (ICUs) to evaluate disease severity in patients [6-10]. These scoring systems assist in the prediction of patient mortality and allow comparison of standards of care in different ICUs. Among the scoring systems, the pediatric index of mortality (PIM) has been considered a representative model. The PIM, developed from data collected from pediatric ICUs in New Zealand, the United Kingdom, and Australia between 1994 and 1996 by Shann et al. [8], is a simple model that consisted of 10 variables measured at the time of admission to the ICU [9]. In addition to mortality prediction, the PIM had a function for evaluating the quality of medical care and optimizing the employment of resources [11,12].
Another widely used prediction model, the pediatric risk of mortality (PRISM) model, was developed using data collected from pediatric ICUs in the United States between 1980 and 1985 by Pollack et al. [7]; this was later updated in 1996 [10]. The PRISM III score is calculated from the patient’s physiologic data, descriptive information, and diagnosis. The PRISM III predicts the risk for mortality during that admission.
The PIM models were assessed by comparing them with prediction models, such as PRISM III, in order to determine their ability to predict prognostic scores [13-15]. The results of the first study investigating the PIM showed that it was a good model for the prediction and classification of mortality in groups of children and adolescents in the ICU [8]. One advantage of the PIM model over the PRISM model is that it is based on 10 variables only, all of which are collected at the point of admission; the PRISM requires 24 hours of intensive care management before data can be collected [16]. Several other studies have reported that the previous PIM models have performed well in the prediction of mortality [14,17,18].
The various mortality prediction models need to be validated before they can be applied in environments that differ from those in which they were developed. In 2003, the PIM study group published a revised version of the PIM. Compared with the original version, PIM 2 showed better calibration and had better adjustment for varying diagnostic groups [19]. In Korea, PIM 2 had better results than PRISM III in mortality prediction [20]. The PIM was again updated in 2013 and was called the PIM 3; however, this new version has not yet been evaluated in Korea.
The objective of this study was to evaluate the usefulness of the PIM 3 for predicting mortality and to validate PIM 3 in Korean children admitted to a single ICU. Additionally, we aimed to determine other factors strongly correlated with the predicted mortality rate.
MATERIALS AND METHODS
Study Design
This was a retrospective study of children admitted to the Severance Hospital Medical ICU at Yonsei University College of Medicine between March 2009 and February 2015.
Patient Selection
All patients at least 1 month old but less than 18 years of age who were admitted to the Severance Hospital Medical ICU during the study period were included. Patients who were discharged or who died within 24 hours of ICU admission were excluded. Additionally, patients were excluded from the study if data entry was incomplete. Neonates in the neonatal ICU, children in postoperative recovery in the surgical ICU, and children with cardiac problems in the cardiac ICU were not included.
Data Collection
This was a retrospective study in which data were collected from medical records. Demographic data were collected from all study participants, including age, sex, diagnosis, admission route, and length of stay in the ICU. Patients were divided into age groups (infants, preschoolers, schoolchildren, and adolescents). The admission route was divided into the general ward, emergency room, and operating room. According to the original studies, 17 physiological data and eight additional risk factors were collected for the PRISM III, and 10 physiological data were collected for the PIM 2 and PIM 3 (Table 1). The outcome of interest was survival; a non-survivor was defined as a patient who died in the ICU, who was discharged for palliative care, or who died within 24 hours of discharge. Experienced nurses and ICU doctors reviewed all the data.
The PRISM III, PIM 2, and PIM 3 scores were calculated using the formulas available in published findings [9,10]. The PRISM III score was calculated using 17 physiological parameters and additional risk factors. Physiologic data included the most abnormal values among 17 variables in the first 24 hours of the ICU stay. The PIM 3 score was calculated using 10 physiological variables collected within the first hour of admission to the ICU.
Statistical Analysis
Parametrically distributed values were expressed as mean±standard deviation (SD). Demographic and physiologic data were described using Student t-tests for continuous variables and the chi-square tests for categorical variables. The performance of each scoring system was evaluated by assessing area under the receiver operating characteristic (ROC) curve, conducting the Hosmer-Lemeshow test, and calculating the standardized mortality ratio (SMR).
The capacity for discrimination between a survivor and non-survivor was made using the area under the ROC curve. An area under the ROC curve of 0.75 or more was considered statistically significant [21]. The areas under the ROC curve for PRISM III, PIM 2, and PIM 3 were compared using the chisquare test.
Statistical analysis of the calibration of each model was conducted using the Hosmer-Lemeshow test. The Hosmer-Lemeshow test is a statistical test that compares the observed and expected mortality risk for goodness of fit [22]. To assess the calibration of the ICU scoring systems, the expected and observed numbers of survivors and mortalities in deciles of risk were calculated. A large, significant difference in the observed and expected values signifies that the model did not meet the goodness of fit test. In this statistical analysis, the model was judged appropriate when the P-value was 0.05 or more [23].
The overall prediction for the risk of mortality was assessed by calculating the expected and observed numbers of survivors and mortalities using the SMR calculation. The SMR with a 95% confidence interval (CI) was calculated by dividing the actual mortality rate by the cumulative predicted mortality rate for the study population [24]. An SMR close to 1 signifies better prediction; an SMR significantly less or more than 1 could be interpreted as an overestimation or underestimation of mortality in the ICU. Statistical analysis and data management were performed using Excel 2010 (Microsoft, Redmond, WA, USA) and IBM SPSS version 23.0 (IBM Corp., Armonk, NY, USA). P-values less than 0.05 were considered statistically significant.
Ethics Statement
All data were collected and analyzed retrospectively in this study. This study was approved by the Institutional Review Board of Severance Hospital, Seoul, Korea (IRB No. 4-2015-1194).
RESULTS
Clinical Characteristics of Patients
In total, 583 patients were included in the study; however, 29 were excluded because they died or were discharged within 24 hours of admission, and 51 were excluded because data were incomplete. Therefore, 503 patients were actually enrolled in the study.
Table 2 shows the clinical and demographic characteristics of the patients in the study population. There were 297 male patients (59.0%) and 206 female patients (41.0%). The majority of patients were preschoolers at ICU admission (n=215, 42.7%). Diagnostic categories at ICU admission included pulmonology problems, such as respiratory infections or airway obstructions (n=267, 53.1%); neurologic problems, such as status epilepticus or central nervous system infections (n=96, 19.1%); postoperative care such as percutaneous endoscopic gastrostomy or fundoplication (n=41, 8.2%); hematology-oncologic problems, such as neutropenic fever during chemotherapy or tumor lysis syndrome (n=34, 6.8%); nephrology problems, such as renal failure or need for renal replacement therapy (n=26, 5.2%); gastrointestinal problems, such as intestinal bleeding or fulminant hepatitis (n=20, 4.0%); and others, such as cardiac arrest of unknown origin (n=19, 3.8%). In total, 51.1% of patients (n=257) were admitted from the general ward. The overall ICU mortality rate was 19.9% (n=100). According to the admission route, the mortality rates were 26.8%, 12.3%, and 14.7% for the general ward, emergency room, and operating room, respectively.
There were no differences in sex (P=0.369) and time to ICU discharge (P=0.068) between the survivor and non-survivor group. Patients were older in the non-survivor group than in the survivor group (P=0.003).
PIM 3 between the Survivor and Non-survivor Groups
There were significant differences in the PIM 3 scoring parameters between survivors and non-survivors, as shown in Table 3. The mortality rates were 15.4% and 58.4% for the high-risk and very high-risk groups, respectively. More patients in the survivor group recovered from surgery and/or the other procedures investigated in this study (P=0.027). When compared with survivors, the non-survivors were more likely to be treated with a ventilator at the time of ICU admission (P=0.013) or categorized as being at very high risk for mortality (P<0.001).
PIM 3 Performance
The areas under the ROC curve were 0.775 (95% CI, 0.736 to 0.811), 0.796 (95% CI, 0.758 to 0.831), and 0.826 (95% CI, 0.790 to 0.858) for PRISM III, PIM 2, and PIM 3, respectively. The area under the ROC curve was significantly greater for PIM 3 than for PIM 2 (P<0.001) and PRISM III (P=0.016) (Figure 1).
Table 4 shows the overall calibration of the models across the deciles of mortality risk by using the Hosmer-Lemeshow test. There were no significant differences observed in expected deaths (PRISM III, P=0.498; PIM 2, P=0.249; PIM 3, P=0.337). All three models showed goodness of fit.
The SMRs were 0.84 (95% CI, 0.68 to 1.02) and 1.11 (95% CI, 0.91 to 1.35) for PIM scores 2 and 3, respectively. The SMR calculated using PIM 3 was closer to 1 than that calculated using PIM 2 (Figure 2).
SMR According to Age or Admission Route
According to age, SMR of schoolchild age group is highest, and infant age group is lowest. There is also difference in SMR according to admission route. SMR of patient from general ward is 1.22, and SMR of patient admitted through emergency room is 0.58 (Table 5).
DISCUSSION
This is the validation study that assessed the new version of PIM 3 in Korean children, in an environment substantially different from the environment in which PIM 3 was generated. We compared the performances of PRISM III, PIM 2, and PIM 3 at a single institution using three statistical methods: area under the ROC curve, the Hosmer-Lemeshow test, and SMR. On the basis of the results of these three statistical methods, we conclude that PIM 3 performs better for predicting mortality than PIM 2 or PRISM III, and it is suitable for use in the Korean children.
There are major changes in the grouping system in the PIM 3 scoring model compared with PIM 2 [9]. First, there are three new risk indicator fields in PIM 3 categorized as very high-risk, high-risk, and low-risk groups. The very high-risk category included patients with cardiac arrest preceding ICU admission, severe combined immune deficiencies, leukemia or lymphoma after first induction therapy, patients who were bone marrow transplant recipients, and patients with liver failure. All these patients were previously categorized as being at high-risk according to PIM 2. In our study, 237 patients who were categorized as being at high-risk according to PIM 2 were subdivided into high-risk (n=136) and very high-risk (n=101) categories according to PIM 3. Another 19 patients were newly classified into the low-risk category using PIM 3; most of them had seizures, which are not categorized into a risk classification using PIM 2. Second, only the most severe risk factor could be used in the calculation for PIM 3 validation. However, both high-risk and low-risk categories can be used for the calculation of PIM 2 validation. These changes are a significant reason why the PIM 3 is suitable for use.
PIM 3 is the most recently updated model for predicting mortality among patients admitted to the ICU, but it has been criticized for predicting the risk of mortality among neonates and adolescents [25]. As previously discussed [1], the PIM score has a possible limitation in measuring blood pressure in neonates. Normal blood pressure in neonates is very different depending on body weight. Our study did not include neonates less than 1 month old; however, we categorized patients based on age: infants, preschoolers, schoolchildren, and adolescents. The SMRs were shown in Table 5. The mortality prediction was less accurate in infants than among the other age categories. These results imply that PIM 3 may be insufficient for predicting mortality not only in neonates but also infants.
Another possible factor that could affect the precise mortality prediction is the admission route to the ICU: general ward, emergency room, and operating room. Depending on the admission route, the medical environment experienced by the patients before admission is very different. The PIM 3 scores were calculated after ICU admission; therefore, we assumed that the admission route could affect the PIM 3 score. Patients admitted from the general ward may have appeared to be more stable than they actually were because they had received prior medical treatment. Conversely, patients admitted from the emergency room may have appeared to have more severe disease than they actually did. We investigated patients’ admission pathways and compared their SMRs. The SMRs were 1.22 and 0.58 for those admitted from the general ward and from the emergency room, respectively. There were more deaths than expected among those admitted from the general ward, and there were fewer deaths than expected among those admitted from the emergency room. The treatment environment according to the hospitalization route may be different, and this could potentially affect PIM scoring.
In this study, the SMR of PIM 3 is higher than those in other studies which are 1.0 and 0.98 [9,15]. Because our study has more children with neurologic main problem. The SMR of patients with neurologic main problem was reported to be higher than those in patients with other main problems such as pulmonology or nephrology [9]. Our result of the area under the curve of PIM3 (0.826) is similar to that of other studies (0.88 [15] and 0.76 [26]).
Our study confirmed the suitability of using PIM 3 through multidimensional statistical analysis and comparison analysis with PIM 2 and PRISM III. Additionally, we investigated other possible factors that could have affected mortality prediction. Despite the strengths of this study, there were several limitations. First, there was an insufficient patient enrollment; we did not include neonatal, surgical, and cardiac ICU patients. Additionally, this study was conducted at a single center. Multicenter studies that include neonatal, surgical, and cardiac ICU patients will be needed in the future. Second, our study was conducted in a retrospective manner. The authors did their best, but there were patients who were excluded from the study because of incomplete data. There is a need for prospective studies on this topic.
In conclusion, PIM 3 is a simple and useful tool for predicting mortality among children admitted to the ICU. Our study showed that PIM 3 showed better prediction of the risk of mortality in children admitted to the ICU, when compared to PIM 2. Depending on the medical environment, the admission route and age of the patient may affect the PIM 3 scoring system.
KEY MESSAGES
▪ Pediatric index of mortality (PIM) 3 is a useful tool for predicting mortality among children admitted to the intensive care unit (ICU).
▪ PIM 3 showed better prediction of the risk of mortality in children admitted to the ICU, when compared to PIM 2.
NOTES
-
No potential conflict of interest relevant to this article was reported.
Acknowledgments
The authors thank the grant of the Korea Health Technology R&D Project through the Korea Health Industry Development Institute (KHIDI), funded by the Ministry of Health and Welfare, Republic of Korea (HI17C0104) for the support.
Figure 1.Area under the receiver operating characteristic (ROC) curve of pediatric risk of mortality (PRISM) III, pediatric index of mortality (PIM) 2 and PIM 3. Area under the ROC of PIM 3 was significantly greater than PIM 2 (P<0.001) and PRISM III (P=0.016). AUC: area under the curve.
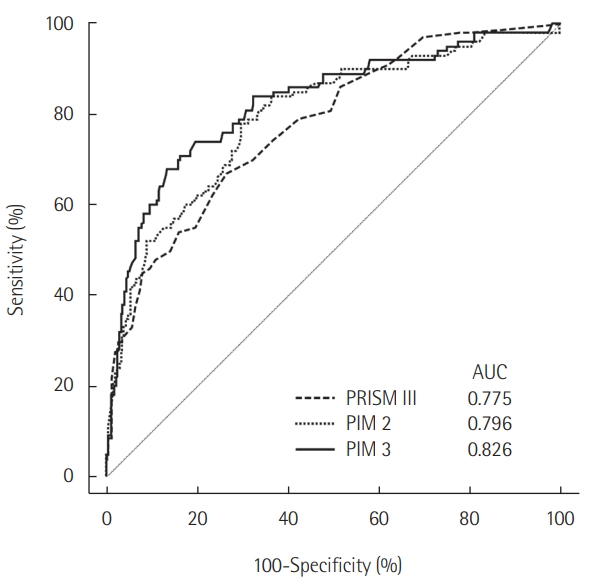
Figure 2.Calibration curves for observed mortality against predicted risk of death for the pediatric index of mortality (PIM) 2 and PIM 3 models. The standardized mortality ratio (SMR) calculated using PIM 3 was closer to 1 than that calculated using PIM 2.
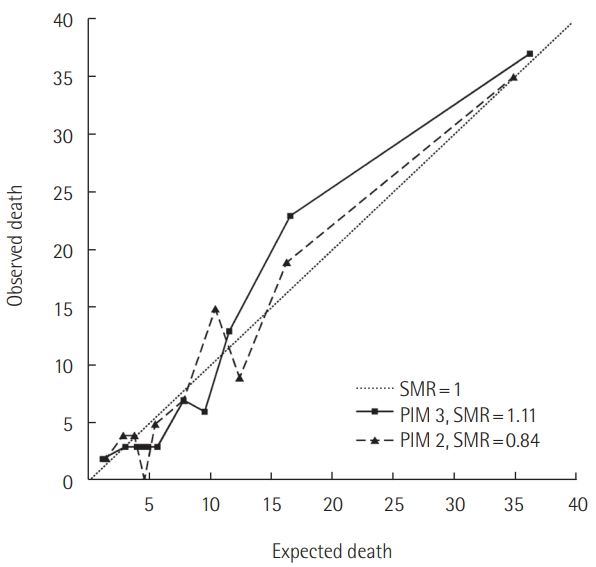
Table 1.Variables of PRISM III, PIM 2, and PIM 3
|
PRISM III |
PIM 2 |
PIM 3 |
|
|
SBP (mmHg) |
Absolute (SBP-120) |
SBP at admission |
|
|
Heart rate (/min) |
Pupils fixed to light (Y/N) |
Pupils fixed to light (Y/N) |
|
|
Body temperature (°C) |
FiO2X100/PaO2 (mmHg) |
FiO2X100/PaO2 (mmHg) |
|
|
Pupil reflex |
Absolute (base excess) |
Absolute (base excess) |
|
|
Mental status |
Mechanical ventilation |
Mechanical ventilation in the first hour (Y/N) |
|
|
Total CO2 (mmHg) |
Elective admission (Y/N) |
Elective admission (Y/N) |
|
|
pH |
Recovery post procedure |
Recovery post procedure |
|
|
PaCO2 (mmHg) |
Bypass (Y/N) |
From bypass cardiac surgery |
|
|
Glucose (mg/dl) |
|
From non-bypass cardiac surgery |
|
|
Potassium (mEq/l) |
|
From non-cardiac procedure |
|
|
Creatinine (mg/dl) |
Risk factora
|
Risk factorb
|
|
|
BUN (mg/dl) |
Low-risk diagnosis |
Low-risk diagnosis |
|
|
White blood cell |
High-risk diagnosis |
High-risk diagnosis |
|
|
Prothrombin time |
|
Very high-risk diagnosis |
|
|
Partial thrombin time |
|
|
|
|
Platelets |
|
|
|
Table 2.Demographic and clinical characteristics of the study population
|
Variable |
Survivor (n=403) |
Non-survivor (n=100) |
Total (n=503) |
|
Male sex |
234 (58.1) |
63 (63.0) |
297 (59.0) |
|
Age (yr)a
|
4.5±4.5 |
6.2±5.0 |
4.8±4.6 |
|
ICU stay duration (day)a
|
1 4.7± 1 8.7 |
26.8±65.1 |
17.1±34.5 |
|
Age |
|
|
|
|
Infant (1-11 mo) |
104 (90.4) |
11 (9.6) |
115 (22.9) |
|
Preschooler (1-5 yr) |
169 (78.6) |
46 (21.4) |
215 (42.7) |
|
Schoolchildren (6-11 yr) |
95 (77.9) |
27 (22.1) |
122 (24.3) |
|
Adolescent (12-18 yr) |
35 (68.6) |
16 (31.4) |
51 (10.1) |
|
Main problem |
|
|
|
|
Pulmonology |
216 (80.9) |
51 (19.1) |
267 (53.1) |
|
Neurology |
82 (85.4) |
14 (14.6) |
96 (19.1) |
|
Postoperation/procedure |
39 (95.1) |
2 (4.9) |
41 (8.2) |
|
Hemato-oncology |
17 (50.0) |
17 (50.0) |
34 (6.8) |
|
Nephrology |
20 (76.9) |
6 (23.1) |
26 (5.2) |
|
Gastroenterology |
13 (65.0) |
7 (35.0) |
20 (4.0) |
|
Others |
16 (84.2) |
3 (15.8) |
19 (3.8) |
|
Admission route |
|
|
|
|
General ward |
188 (73.2) |
69 (26.8) |
257 (51.1) |
|
Emergency room |
186 (87.7) |
26 (12.3) |
212 (42.1) |
|
Operating room |
29 (85.3) |
5 (14.7) |
34 (6.8) |
Table 3.Characteristics of variables in PIM 3 between the survivor and non-survivor groups
|
Parameter |
Survivor (n=403) |
Non-survivor (n=100) |
P-value |
|
Systolic BP (mmHg) |
|
|
|
|
Infant (1-11 mo) |
84.4±17.9 |
70.3±18.2 |
0.004 |
|
Preschooler (1-5 yr) |
87.7± 1 7.3 |
72.3±24.2 |
<0.001 |
|
Schoolchildren (6-11 yr) |
95.2±21.2 |
83.3±25.6 |
0.017 |
|
Adolescent (12-18 yr) |
93.6±19.7 |
80.6±27.0 |
0.033 |
|
No pupil light reflex |
9 (2.2) |
20 (20.0) |
<0.001 |
|
FiO2X100/PaO2
|
0.396±0.297 |
0.734±0.61 4 |
<0.001 |
|
Base excess |
-2.1 ±7.0 |
-4.7±9.7 |
0.002 |
|
Mechanical ventilation |
362 (89.8) |
97 (97.0) |
0.013 |
|
Elective admission |
33 (8.1) |
2 (1.8) |
0.019 |
|
Recovery from a procedure |
38 (9.3) |
3 (2.7) |
0.027 |
|
Risk assessment |
|
|
|
|
Low-risk group |
26 (6.5) |
0 |
0.009 |
|
High-risk group |
115 (28.5) |
21 (21.0) |
0.129 |
|
Very high-risk group |
42 (10.5) |
59 (59.0) |
<0.001 |
Table 4.Hosmer-Lemeshow test for deciles of risk
PRISM III
|
PIM 2
|
PIM 3
|
|
Value |
n |
O |
E |
Value |
n |
O |
E |
Value |
n |
O |
E |
|
0-0 |
83 |
2 |
4.78 |
0.005-0.030 |
50 |
2 |
1.53 |
0.002-0.016 |
50 |
2 |
1.12 |
|
1-2 |
41 |
1 |
2.91 |
0.030-0.052 |
50 |
4 |
2.92 |
0.016-0.038 |
51 |
3 |
2.93 |
|
3-4 |
37 |
6 |
3.08 |
0.052-0.070 |
50 |
4 |
3.78 |
0.038-0.053 |
50 |
3 |
4.04 |
|
5-5 |
48 |
5 |
4.90 |
0.070-0.092 |
50 |
0 |
4.61 |
0.053-0.065 |
50 |
3 |
4.80 |
|
6-7 |
44 |
7 |
5.42 |
0.092-0.127 |
50 |
5 |
5.47 |
0.065-0.086 |
50 |
3 |
5.64 |
|
8-9 |
50 |
9 |
7.41 |
0.127-0.238 |
50 |
7 |
7.81 |
0.086-0.138 |
51 |
7 |
7.79 |
|
10-11 |
44 |
8 |
8.02 |
0.238-0.303 |
50 |
15 |
10.44 |
0.138-0.177 |
50 |
6 |
9.55 |
|
12-14 |
48 |
12 |
11.07 |
0.303-0.365 |
50 |
9 |
12.37 |
0.177-0.251 |
50 |
13 |
11.52 |
|
15-20 |
52 |
17 |
17.75 |
0.365-0.674 |
50 |
19 |
16.27 |
0.251-0.514 |
50 |
23 |
16.46 |
|
21-51 |
56 |
33 |
34.65 |
0.674-0.996 |
53 |
35 |
34.81 |
0.514-0.999 |
51 |
37 |
36.15 |
|
Total |
503 100 |
|
- |
Total |
503 |
100 |
- |
Total |
503 |
100 |
- |
|
χ2(8)=7.36, P=0.498 |
χ2(8)=10.24, P=0.249 |
χ2(8)=9.06, P=0.337 |
Table 5.SMR according to age and admission route
|
Parameter |
SMR |
|
Age |
|
|
Infant (1-11 mo) |
0.32 |
|
Preschooler (1-5 yr) |
0.99 |
|
Schoolchildren (6-11 yr) |
1.08 |
|
Adolescent (12-18 yr) |
0.89 |
|
Admission route |
|
|
General ward |
1.22 |
|
Emergency room |
0.58 |
|
Operation room |
0.99 |
References
- 1. Marcin JP, Wetzel RC. The parsimonious pediatric index of mortality. Pediatr Crit Care Med 2013;14:718-9.ArticlePubMed
- 2. Knaus WA, Wagner DP, Draper EA, Zimmerman JE, Bergner M, Bastos PG, et al. The APACHE III prognostic system: risk prediction of hospital mortality for critically ill hospitalized adults. Chest 1991;100:1619-36.ArticlePubMed
- 3. Hargrove J, Nguyen HB. Bench-to-bedside review: outcome predictions for critically ill patients in the emergency department. Crit Care 2005;9:376-83.ArticlePubMedPMC
- 4. Kirkham FJ, Newton CR, Whitehouse W. Paediatric coma scales. Dev Med Child Neurol 2008;50:267-74.ArticlePubMed
- 5. Pomerance HH. Nelson textbook of pediatrics. Arch Pediatr Adolesc Med 1997;151:324. Article
- 6. Pollack MM, Yeh TS, Ruttiman UE, Holbrook PR, Fields AI. Evaluation of pediatric intensive care. Crit Care Med 1984;12:376-83.ArticlePubMed
- 7. Pollack MM, Ruttimann UE, Getson PR. Pediatric risk of mortality (PRISM) score. Crit Care Med 1988;16:1110-6.ArticlePubMed
- 8. Shann F, Pearson G, Slater A, Wilkinson K. Paediatric index of mortality (PIM): a mortality prediction model for children in intensive care. Intensive Care Med 1997;23:201-7.ArticlePubMed
- 9. Straney L, Clements A, Parslow RC, Pearson G, Shann F, Alexander J, et al. Paediatric index of mortality 3: an updated model for predicting mortality in pediatric intensive care. Pediatr Crit Care Med 2013;14:673-81.ArticlePubMed
- 10. Pollack MM, Patel KM, Ruttimann UE. PRISM III: an updated pediatric risk of mortality score. Crit Care Med 1996;24:743-52.ArticlePubMed
- 11. Pollack MM, Cuerdon TT, Patel KM, Ruttimann UE, Getson PR, Levetown M. Impact of quality-of-care factors on pediatric intensive care unit mortality. JAMA 1994;272:941-6.ArticlePubMed
- 12. Slater A, Shann F, ANZICS Paediatric Study Group. The suitability of the pediatric index of mortality (PIM), PIM2, the pediatric risk of mortality (PRISM), and PRISM III for monitoring the quality of pediatric intensive care in Australia and New Zealand. Pediatr Crit Care Med 2004;5:447-54.ArticlePubMed
- 13. Martha VF, Garcia PC, Piva JP, Einloft PR, Bruno F, Rampon V. Comparison of two prognostic scores (PRISM and PIM) at a pediatric intensive care unit. J Pediatr (Rio J) 2005;81:259-64.ArticlePubMed
- 14. Thukral A, Lodha R, Irshad M, Arora NK. Performance of pediatric risk of mortality (PRISM), pediatric index of mortality (PIM), and PIM2 in a pediatric intensive care unit in a developing country. Pediatr Crit Care Med 2006;7:356-61.ArticlePubMed
- 15. Wolfler A, Osello R, Gualino J, Calderini E, Vigna G, Santuz P, et al. The importance of mortality risk assessment: validation of the pediatric index of mortality 3 score. Pediatr Crit Care Med 2016;17:251-6.ArticlePubMed
- 16. Jones GD, Thorburn K, Tigg A, Murdoch IA. Preliminary data: PIM vs PRISM in infants and children post cardiac surgery in a UK PICU. Intensive Care Med 2000;26:145. ArticlePubMed
- 17. Netto AL, Muniz VM, Zandonade E, Maciel EL, Bortolozzo RN, Costa NF, et al. Performance of the pediatric index of mortality 2 in a pediatric intensive care unit. Rev Bras Ter Intensiva 2014;26:44-50.ArticlePubMedPMC
- 18. Ciofi degli Atti ML, Cuttini M, Ravà L, Rinaldi S, Brusco C, Cogo P, et al. Performance of the pediatric index of mortality 2 (PIM-2) in cardiac and mixed intensive care units in a tertiary children’s referral hospital in Italy. BMC Pediatr 2013;13:100. ArticlePubMedPMCPDF
- 19. Slater A, Shann F, Pearson G, Paediatric Index of Mortality (PIM) Study Group. PIM2: a revised version of the paediatric index of mortality. Intensive Care Med 2003;29:278-85.ArticlePubMed
- 20. Hwang HS, Lee NY, Han SB, Kwak GY, Lee SY, Chung SY, et al. Performance effectiveness of pediatric index of mortality 2 (PIM2) and pediatric risk of mortality III (PRISM III) in pediatric patients with intensive care in single institution: retrospective study. Korean J Pediatr 2008;51:1158-64.Article
- 21. Zou KH, O’Malley AJ, Mauri L. Receiver-operating characteristic analysis for evaluating diagnostic tests and predictive models. Circulation 2007;115:654-7.ArticlePubMed
- 22. Lemeshow S, Hosmer DW Jr. A review of goodness of fit statistics for use in the development of logistic regression models. Am J Epidemiol 1982;115:92-106.ArticlePubMedPDF
- 23. Rapoport J, Teres D, Lemeshow S, Gehlbach S. A method for assessing the clinical performance and cost-effectiveness of intensive care units: a multicenter inception cohort study. Crit Care Med 1994;22:1385-91.ArticlePubMed
- 24. Pearson GA, Stickley J, Shann F. Calibration of the paediatric index of mortality in UK paediatric intensive care units. Arch Dis Child 2001;84:125-8.ArticlePubMedPMC
- 25. Choi KM, Ng DK, Wong SF, Kwok KL, Chow PY, Chan CH, et al. Assessment of the pediatric index of mortality (PIM) and the pediatric risk of mortality (PRISM) III score for prediction of mortality in a paediatric intensive care unit in Hong Kong. Hong Kong Med J 2005;11:97-103.PubMed
- 26. Lee OJ, Jung M, Kim M, Yang HK, Cho J. Validation of the pediatric index of mortality 3 in a single pediatric intensive care unit in Korea. J Korean Med Sci 2017;32:365-70.ArticlePubMed
Citations
Citations to this article as recorded by

- Clinical Features and Management of Status Epilepticus in the Pediatric Intensive Care Unit
Ekin Soydan, Yigithan Guzin, Sevgi Topal, Gulhan Atakul, Mustafa Colak, Pinar Seven, Ozlem Sarac Sandal, Gokhan Ceylan, Aycan Unalp, Hasan Agin
Pediatric Emergency Care.2023; 39(3): 142. CrossRef - Evaluation of the Performance of PRISM III and PIM II Scores in a Tertiary Pediatric Intensive Care Unit
Büşra Uzunay Gündoğan, Oğuz Dursun, Nazan Ülgen Tekerek, Levent Dönmez
Turkish Journal of Pediatric Emergency and Intensive Care Medicine.2023; 10(1): 8. CrossRef - Incidence and Mortality Trends in Critically Ill Children: A Korean Population-Based Study
Jaeyoung Choi, Esther Park, Ah Young Choi, Meong Hi Son, Joongbum Cho
Journal of Korean Medical Science.2023;[Epub] CrossRef - Internal validation and evaluation of the predictive performance of models based on the PRISM-3 (Pediatric Risk of Mortality) and PIM-3 (Pediatric Index of Mortality) scoring systems for predicting mortality in Pediatric Intensive Care Units (PICUs)
Zahra Rahmatinejad, Fatemeh Rahmatinejad, Majid Sezavar, Fariba Tohidinezhad, Ameen Abu-Hanna, Saeid Eslami
BMC Pediatrics.2022;[Epub] CrossRef - Performance of Pediatric Risk of Mortality III and Pediatric Index of Mortality III Scores in Tertiary Pediatric Intensive Unit in Saudi Arabia
Ahmed S. Alkhalifah, Abdulaziz AlSoqati, Jihad Zahraa
Frontiers in Pediatrics.2022;[Epub] CrossRef - Clinical implications of discrepancies in predicting pediatric mortality between Pediatric Index of Mortality 3 and Pediatric Logistic Organ Dysfunction-2
Eui Jun Lee, Bongjin Lee, You Sun Kim, Yu Hyeon Choi, Young Ho Kwak, June Dong Park
Acute and Critical Care.2022; 37(3): 454. CrossRef - Administrative data in pediatric critical care research—Potential, challenges, and future directions
Nora Bruns, Anna-Lisa Sorg, Ursula Felderhoff-Müser, Christian Dohna-Schwake, Andreas Stang
Frontiers in Pediatrics.2022;[Epub] CrossRef - Development of a machine learning model for predicting pediatric mortality in the early stages of intensive care unit admission
Bongjin Lee, Kyunghoon Kim, Hyejin Hwang, You Sun Kim, Eun Hee Chung, Jong-Seo Yoon, Hwa Jin Cho, June Dong Park
Scientific Reports.2021;[Epub] CrossRef - Meta-Analysis for the Prediction of Mortality Rates in a Pediatric Intensive Care Unit Using Different Scores: PRISM-III/IV, PIM-3, and PELOD-2
Yaping Shen, Juan Jiang
Frontiers in Pediatrics.2021;[Epub] CrossRef - Simplified Pediatric Index of Mortality 3 Score by Explainable Machine Learning Algorithm
Orkun Baloglu, Matthew Nagy, Chidiebere Ezetendu, Samir Q. Latifi, Aziz Nazha
Critical Care Explorations.2021; 3(10): e0561. CrossRef - Performance of Pediatric Index of Mortality in a Tertiary Care PICU in India
Nisha Toteja, Bharat Choudhary, Daisy Khera, Rohit Sasidharan, Prem Prakash Sharma, Kuldeep Singh
Journal of Pediatric Intensive Care.2021;[Epub] CrossRef

 , Min Jung Kim1,2

 PubReader
 ePub Link
 Cite
Cite


