Abstract
-
Background
- Decreases in heart rate variability have been shown to be associated with poor outcomes in severe acute brain injury. However, it is unknown whether the changes in heart rate variability precede neurological deterioration in such patients. We explored the changes in heart rate variability measured by electrocardiography in patients who had neurological deterioration following severe acute brain injury, and examined the relationship between heart rate variability and electroencephalography parameters.
-
Methods
- Retrospective analysis of 25 patients who manifested neurological deterioration after severe acute brain injury and underwent simultaneous electroencephalography plus electrocardiography monitoring.
-
Results
- Eighteen electroencephalography channels and one simultaneously recorded electrocardiography channel were segmented into epochs of 120-second duration and processed to compute 10 heart rate variability parameters and three quantitative electroencephalography parameters. Raw electroencephalography of the epochs was also assessed by standardized visual interpretation and categorized based on their background abnormalities and ictalinterictal continuum patterns. The heart rate variability and electroencephalography parameters showed consistent changes in the 2-day period before neurological deterioration commenced. Remarkably, the suppression ratio and background abnormality of the electroencephalography parameters had significant reverse correlations with all heart rate variability parameters.
-
Conclusions
- We observed a significantly progressive decline in heart rate variability from the day before the neurological deterioration events in patients with severe acute brain injury were first observed.
-
Keywords: brain injuries; critical care; electrocardiography; electroencephalography
INTRODUCTION
Severe acute brain injury is commonly defined as an acute brain insult that causes a prolonged loss of consciousness (Glasgow Coma Scale [GCS] of 8 or less) and includes traumatic brain injury, stroke, meningoencephalitis, and hypoxic brain injury [1,2]. Although the etiologies of severe acute brain injury are diverse, any kind of brain injury can lead to secondary brain damage processes that result in seizures, brain ischemia, brain edema, and even brain death. Therefore, neurophysiologic monitoring of the brain to detect and prevent neurological deterioration before the development of irreversible secondary brain damage is of paramount importance for improving the prognosis of patients with severe acute brain injury.
Neurophysiological changes in injured brains can be captured by various monitoring techniques that measure intracranial pressure, cerebral perfusion pressure, cerebral blood flow, brain tissue oxygenation, and cerebral metabolism. However, these methods have limitations such as the risk of complications and the requirement for extensive health resources. Additionally, the benefits of some of the latest technologies are yet to be demonstrated [3]. Electroencephalography (EEG) provides a noninvasive, bedside measurement of electrocortical activity, and its changes reliably reflect realtime alterations in cerebral blood flow and metabolism [4]. Hence, continuous EEG monitoring to detect subclinical brain damage such as seizures and ischemia in comatose patients has become a cornerstone in critical care medicine [5,6].
Heart rate variability (HRV) is another noninvasive method that represents quantitative markers of the neuroautonomic regulation of heart rate, and this metric’s standard procedure, definition, and interpretation were established in 1996 [7]. Because HRV is a low-cost and accessible method that only requires standard hospital equipment for recording electrocardiography (ECG), it has been extensively applied to investigate autonomic nervous dysfunction in patients with severe illnesses, including trauma, heart failure, multiple organ failure syndrome, and sepsis [8-12]. Particularly, the loss of HRV in severe acute brain injury has been correlated with high patient morbidity and mortality [13]. Previous studies also showed that HRV is useful for predicting the risk of progression to brain death [14-16]. Nevertheless, it is unknown whether HRV changes occur prior to the observation of neurological deterioration in patients with severe acute brain injury, which may enable its use as a marker of early brain-heart network impairment. The object of this preliminary study was to examine the changes in HRV and EEG parameters before and after the onset of neurological deterioration in patients with severe acute brain injury.
MATERIALS AND METHODS
Patients and Data Collection
This was a retrospective study of adult patients who presented with neurological deterioration after severe acute brain injury and underwent simultaneous EEG plus ECG monitoring in intensive care units between January 1, 2018 and March 1, 2020 at Asan Medical Center, a 2,700-bed tertiary referral center in Seoul, Korea. This study was approved by the Institutional Review Board of Asan Medical Center (IRB No. 2020-0919), and the requirement for informed consent was waived due to the retrospective nature of the study. Severe acute brain injury was defined as brain injury with a decline in GCS score to less than 8 due to acute intracranial pathology. In our study, neurological deterioration was defined as an event with a newly developed loss of pupillary light reflex and radiological confirmation of progressive secondary brain damage, i.e., brain herniation. In order to minimize the influence of factors unrelated to brain dysfunction, we excluded individuals with a history of diabetic neuropathy, atrial flutter or fibrillation, ventricular ectopic beats, recent cardiopulmonary arrest, or use of antiarrhythmic medications.
The following demographic and clinical data were retrieved: age, sex, primary diagnosis, GCS score at the start of continuous EEG monitoring, use of sedative agents, inotropic agents, and anti-seizure drugs, presence of clinical seizures, imaging data including brain computed tomography and/or magnetic resonance imaging of the brain, and survival status at hospital discharge. Neurophysiological data from 18 EEG channels using the standard international 10–20 system and one channel of simultaneously-acquired ECG (obtained as part of the EEG tracing) was used for analysis. The data was segmented in 120-second epochs and epochs with artifacts were excluded from the analysis.
EEG Parameters
Changes in the EEG during secondary brain damage were assessed by standardized visual interpretation and quantitative analysis techniques. Each artifact-free 120-second epoch was visually reviewed using the Standardized Critical Care EEG Terminology of the American Clinical Neurophysiology Society [17] without information on quantitative spectral analysis results. The background activity was categorized as (1) predominant alpha to theta activity or normal/rudimentary N2 sleep transients (K complexes and/or sleep spindles), (2) predominant delta activity and absent N2 sleep transients, and (3) burst-attenuation, burst-suppression, or suppression [18]. Ictal-interictal continuum (IIC) patterns were classified based on their potential associations with ictal events or neuronal injury according to a previous study [19]. EEG classifications are summarized in Table 1.
To calculate the quantitative EEG parameters, artifact-free epochs of 120-second duration were first cleaned using commercial artifact reduction technology (blind source separation) provided as part of Persyst v13 software (Persyst Development Corp., Prescott, AZ, USA) to reduce non-cerebral artifacts in the scalp EEG data. Epochs with ictal events were excluded from quantitative analysis. We then generated quantitative EEG parameters using standard processing engines and exported the mean parameter values for each epoch. To analyze band frequency power, the engine calculated power values (µV2) with a frequency resolution of 0.5 Hz by fast Fourier transform, and the spectra were divided into four broad frequency bands (delta = 1.0–4.0 Hz, theta = 4.0–8.0 Hz, alpha = 8.0–13.0 Hz, and beta = 13.0–32.0 Hz). The alpha/delta band power ratio (ADR) was subsequently calculated. Other quantitative EEG parameters included the asymmetry index (the sum of the absolute differences in power at each pair of homologous electrodes) and the suppression ratio (the percentage of time during which EEG amplitude is ‘‘suppressed,’’ defined as a ≥ 0.5 s < 3 µV amplitude).
HRV Parameters
Among the artifact-free, ictal-free EEG/ECG epochs, those with weak R-wave amplitudes were excluded from the HRV analysis. Next, the R-wave peaks were captured by an automated detection algorithm in the Kubios software (Biosignal Medical Group, Kuopio, Finland). The captured R-to-R intervals were once more manually inspected for arrhythmia or artifacts. The R-to-R intervals obtained through this process are called the “normal-normal (NN) interval”.
Using the NN intervals, linear and non-linear HRV analysis were performed. Linear time-domain methods included standard deviations of the normal-normal intervals (SDNN) and the root mean square of successive NN interval differences (RMSSD). Linear frequency domain analysis using fast Fourier transformation quantified very low frequency power (VLF: ≤ 0.04 Hz), low frequency power (LF: 0.04–0.15 Hz), high frequency power (HF: 0.15–0.4 Hz), and the LF/HF ratio. The VLF, LF, and HF power were log-transformed in statistical analysis because of their skewed distributions. Non-linear HRV analysis included the standard deviations along the transverse axis (SD1) and longitudinal axis of the Poincaré plots (SD2), SD2/SD1 ratio, and the approximate entropy (ApEn). For all HRV parameters, we used 300-second ECG time series that were updated every 10 seconds, and the mean values of 120-second epochs were calculated.
Statistical Analysis
Clinical and neurophysiological parameters were summarized using proportions for discrete variables and mean ±standard deviation or median (interquartile range [IQR]) for continuous variables as appropriate. Subjects were divided into nonsurvivors and survivors according to their survival status at hospital discharge. We used Fisher’s exact tests for categorical data, the Wilcoxon two-sample test for ordinal data, and Student t-tests for continuous data to compare the clinical and neurophysiological characteristics between the two groups. Kruskal-Wallis tests with post-hoc Dunn’s pairwise tests were used to assess the differences in the neurophysiologic parameters between the 24-hour blocks obtained before and after neurological deterioration. The correlations between the EEG parameters and the HRV parameters were measured using Spearman’s correlation coefficient, rs, which can take values between –1 and +1. According to the rule of thumb, the strength of a correlation was considered according to the following guide for the absolute value of rs: 0.10–0.39 (weak), 0.40–0.69 (moderate), 0.70–0.89 (strong), and 0.90–1.00 (very strong) [20]. Two-tailed P-values < 0.01 were considered statistically significant. All statistical analyses were performed using R version 3.6.2 (R Foundation, Vienna, Austria) or GraphPad Prism, version 8.3.1 (GraphPad, La Jolla, CA, USA).
RESULTS
Patient Characteristics
A total of 25 patients were eligible for analysis, and their clinical characteristics are summarized in Table 2. The patients had a mean age of 49 years (range, 20–76 years) and 40% were men. The median GCS score at the start of EEG/ECG monitoring was 3 (IQR, 3–6). In-hospital mortality occurred in 16 patients (64%) (non-survivors), all of which were due to clinical brain death or withdrawal of care due to severe intractable brain injury. The median Glasgow Outcome Scale at discharge among the survivors was 3 (IQR, 3–4.75).
There were no significant differences between the non-survivors and survivors with respect to the use of remifentanil, dexmedetomidine, propofol, midazolam, ketamine, or epinephrine during the monitoring period. The use of norepinephrine was more common in the non-survivor group (81%; 13/16) compared with the survivor group (11%; 1/9) (P = 0.003). Hyperammonemia was the most common etiology, followed by meningoencephalitis and stroke. A cardiac function test was undergone by 19 (76%) out of 25 patients, three of whom showed mild to moderate left ventricular dysfunction (left ventricular ejection fraction 30–49%). The following cardiovascular agents were administered during the period in which the data were collected; calcium channel blocker (8 cases), beta blocker (5 cases), amiodarone (2 cases), digoxin (1 case), adenosine (1 case), and drugs associated with QT prolongation including amiodarone (4 cases). Our analysis included a total of 619 hours of EEG/ECG recording, and we found that the two groups did not differ significantly on the mean duration of EEG/ECG monitoring (28.1 ± 16.1 hours in non-survivors vs. 17.3 ± 15.9 hours in survivors, P = 0.119). After the onset of neurological deterioration, all patients underwent medical and/or surgical treatments for increased intracranial pressure according to their individual needs.
Neurophysiological Changes during Neurological Deterioration
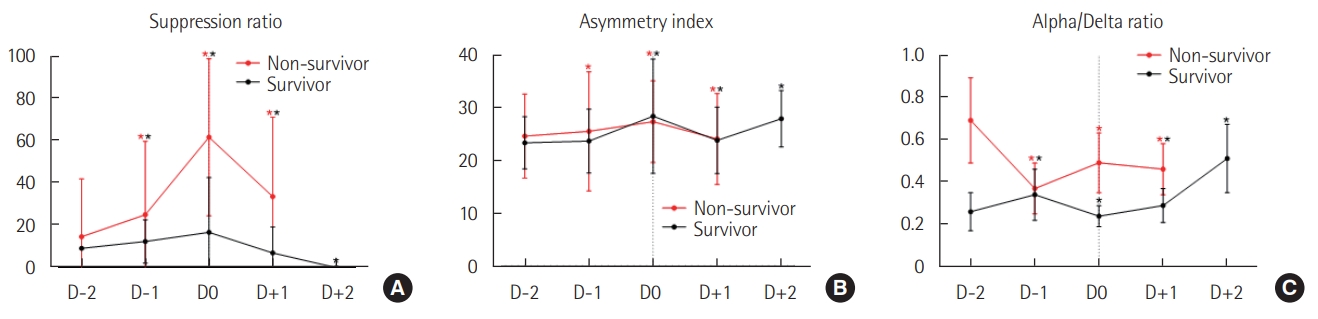
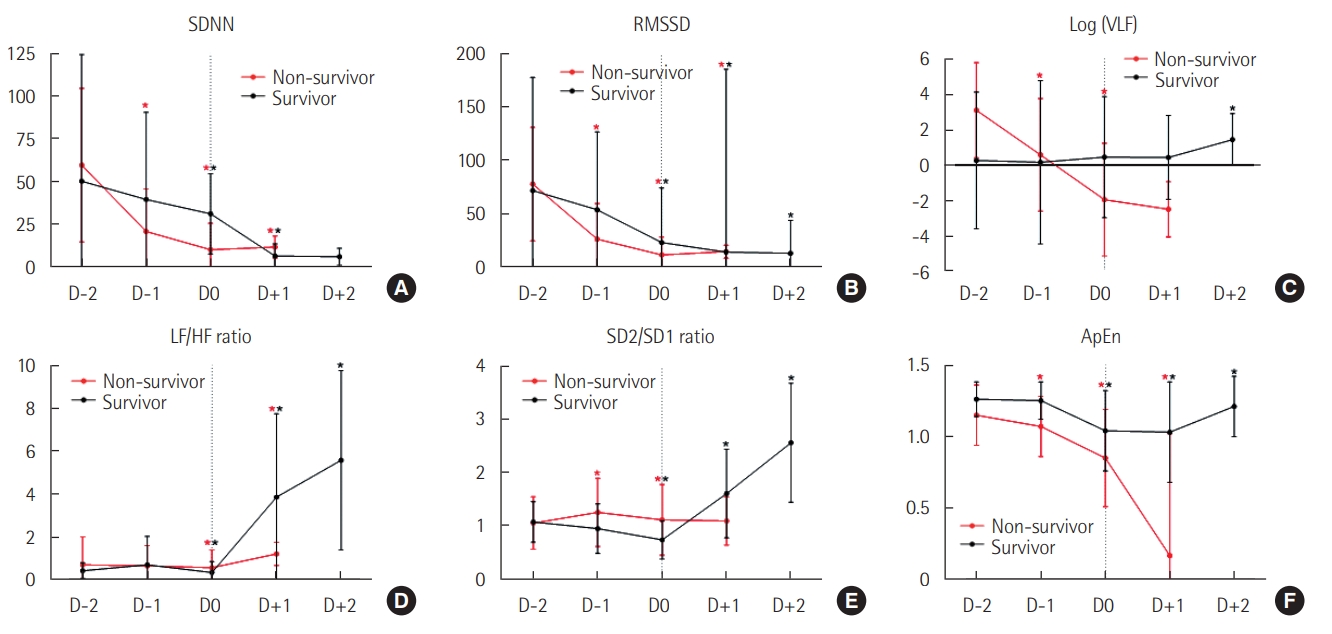
Figures 1 and 2 show the neurophysiological changes that occurred during the 2 days prior to the onset of neurological deterioration (D–2 to D0) and during the 2 days following deterioration onset (D0 to D+2); EEG/ECG data on D+2 were limited in non-survivors and are thus not shown. In both non-survivors and survivors, the suppression ratio and the asymmetry index progressively increased from D–2 and peaked on D0. The ADR showed different patterns between the two groups, as non-survivors showed an overall decline and a significant decrease on D+1 compared with D0, and survivors showed an overall increasing pattern and a significant increase on D+1 compared with D0. The time-domain HRV parameters (SDNN and RMSSD) showed decreasing patterns in both groups, except the significant increase on D+1 in non-survivors. The non-survivors showed a continuous decreasing trend in their VLF power, whereas the survivors did not show significant changes from D–2 to D+1 and then showed a significant increase on D+2. In the survivors, the ratios of LF/HF and SD2/SD1 showed similar patterns of significant increases after the lowest point on D0. ApEn showed a continuous decrease in the non-survivors, while that in the survivors recovered after D0.
Correlation between HRV and EEG Parameters
A total of 18,178 epochs (4,721 from survivors and 13,457 from non-survivors) of simultaneous EEG/HRV measurements were included in the correlation analysis. Figure 3 shows the heatmap of Spearman’s correlation coefficient results. We found a significant negative dependence between the suppression ratio and overall HRV parameters. The strength of correlation was the highest between the suppression ratio and the VLF power (rs= –0.692, P < 0.001). We also found weak negative correlations between the asymmetry index and HRV parameters except for the LF/HF ratio and ApEn (rs= –0.103 to –0.354, P < 0.001). ADR and time-domain HRV parameters were moderately correlated (SDNN: rs= –0.468, P < 0.001; RMSSD: rs= –0.502, P < 0.001), while ADR and VLF power were weakly correlated (rs= –0.326, P < 0.001). ADR had weak but significant positive correlations with LF/HF (rs=0.169, P<0.001) and SD2/SD1 ratio (rs= 0.232, P < 0.001).
Regarding the qualitative EEG ordinal parameters, background severity grade was negatively correlated with all HRV parameters, with rs values ranging from –0.377 for ApEn (P < 0.001) to –0.704 for VLF power (P < 0.001). On the contrary, IIC severity was positively correlated with SDNN (rs= 0.172, P < 0.001), RMSSD (rs= 0.184, P < 0.001), VLF power (rs= 0.155, P < 0.001), and ApEn (rs= 0.221, P < 0.001), although the associations were relatively weaker than those between other EEG parameters and HRV parameters.
DISCUSSION
Through this exploratory analysis, we showed that HRV and EEG parameters undergo significant and consistent changes in the 2-day period prior to neurological deterioration onset. After neurological deterioration onset with the loss of pupillary light reflexes, all patients received medical or surgical management for increased intracranial pressure, which may have impacted the recovery of some neurophysiological parameters after D0 especially in the survivors. Further study is required to determine if the HRV analysis could predict imminent neurological deterioration onset in patients with severe acute brain injury. We also found significant correlations between HRV and the EEG parameters, which is in line with previous studies on sepsis-associated encephalopathy [10] and hypoxic-ischemic brain injury in neonates [21,22].
In recent years, the recording and monitoring of continuous EEG in patients with critical illness has attracted much attention because of its noninvasiveness, and robust, predictive characterization of brain function. Nevertheless, while the detection of nonconvulsive seizures using EEG monitoring has been established as a standard in critical care [5,23], there is no sufficient evidence that EEG monitoring is significantly beneficial for the real-time identification of brain injury progression in high-risk patients. To this end, some studies have focused on using continuous EEG monitoring for delayed cerebral ischemia detection after subarachnoid hemorrhage [24-27]. As such, the identification of impending neurological deterioration using continuous EEG monitoring has been emerging as an important method in neurocritical care.
The integration of multimodality data with continuous EEG may be useful not only for the recognition of EEG artifacts but also for the complementary interpretation of brain function by correlation with multiple physiologic statuses in severe acute brain injury patients. This method may produce a higher degree of accuracy for detecting the evolution of brain injury than using only EEG monitoring in critically ill patients. In order to obtain time-synchronized physiologic data with EEG, transducers can be connected to the EEG machine, which is the general way to record ECG. Transferring physiological data from the monitoring devices to the EEG machine via cables or post hoc integration of data from the devices and the EEG machine can be alternative methods. In our study, one-channel ECG waveforms retrospectively obtained from continuous EEG recordings were of high quality and were used to analyze HRV.
HRV reflects the interaction between the sympathetic and parasympathetic nervous systems that regulate cardiovascular functions. Because HRV is noninvasive and easy to calculate using ECG parameters (ECG is a universal procedure in intensive care units), it is widely used to evaluate critically ill patient autonomic function [9]. Methods for analyzing HRV include linear time-domain analyses (SDNN and RMSSD), linear frequency-domain analyses (VLF, LF, and HF power), and the more recent non-linear analyses (SD2, SD1, and ApEn) [7,28]. In our study, neurological deterioration led to an overall decrease in HRV parameters in patients with severe acute brain injury. Notably, in non-survivors, the declines in SDNN, RMSSD, VLF power, and ApEn were significant from the day before the clinical events were observed. Also, whereas ApEn values significantly recovered after D0 in survivors, the ApEn values dramatically decreased during the monitoring period in non-survivors. Considering our preliminary results and a prior report that non-linear methods can capture the changes in HRV that cannot be readily detected in linear methods [28], it is necessary to standardize and validate the use of non-linear methods along with linear methods in HRV monitoring.
Our results are in line with prior studies that reported decreased HRV in patients with sepsis [10], trauma [12], and other critical illnesses [29-31]. In severe acute brain injury, many studies have documented the association between HRV and clinical outcomes, including intracranial hemorrhage [32], subarachnoid hemorrhage [20], traumatic brain injury [13,14,33-35], ischemic stroke [36], brain metastasis [37], multiple etiologies of acute brain injury [38], neurosurgical patients [39], and brain death [15,16,40-42]. Thus, autonomic dysfunction represented by HRV seems to occur in severely brain-injured patients and is also related to poor outcomes. Despite such findings, whether HRV monitoring can be used for real-time identification of secondary brain damage remains unknown. As such, in addition to evaluating HRV changes over time in patients with neurological deterioration, we conducted a correlation analysis between HRV and the EEG parameters that reflect the degree of brain damage. We found that the suppression ratio was negatively correlated with all HRV parameters. Qualitative EEG background grade was also negatively correlated with all HRV parameters, suggesting that the worse the EEG background, the lower the HRV. The ADR was negatively correlated with HRV parameters except for LH/HF ratio, SD2/SD1 ratio, and ApEn. Also, the suppression ratio and the ADR were positively correlated, suggesting that ADR may increase after the suppression process of EEG activity has already begun. However, as decreased ADR is known to be correlated with delayed cerebral ischemia after subarachnoid hemorrhage [24-27], interpretation of these results should be withheld until confirmation by further studies that investigate different stages of secondary brain damage, from regional ischemia to impending brain death.
There is accumulating evidence that the IIC plays a role in secondary brain damage [43-45]. We used standardized terminology to describe the IIC patterns and evaluated the correlation between IIC and HRV in patients with severe acute brain injury. The severity of IIC was positively correlated with most of the linear and non-linear HRV parameters, even though the associations were relatively weaker than those between other EEG parameters and HRV parameters. Considering prior studies that showed increased HRV in epileptic seizures [46], even though the IIC patterns do not satisfy the definition of an electrographic seizure, these patterns may have a similar association with the autonomic nervous system as ictal events in severe acute brain injury. However, it is important to note that an observed correlation does not necessarily indicate that the relationship between IIC and HRV is causal.
There are some limitations to our study, including a small sample size and a retrospective design that creates a probable selection bias. In particular, since there was no specific indication or priority for the use of limited EEG monitoring devices, the monitoring in patients with severe acute brain injury during the study period was performed at the intensivists’ discretion. Also, no samples have been enriched enough to further investigate other cofactors that decrease HRV, such as type of brain herniation and damage etiology. Nevertheless, the notable impact of neurological deterioration on the neurophysiological parameters allowed for generating statistically significant results despite the small number of cases. Second, as our data were gathered in a real-world setting, the patients had been treated with multiple drugs including sedatives and inotropic agents. Particularly, the prevalence of the use of norepinephrine significantly differed between the non-survivors and the survivors, which might have additionally influenced the HRV. Third, the patients experienced relatively severe neurological deterioration, which was defined as loss of pupillary light reflexes and radiological confirmation of progressive secondary brain damage. Therefore, our conclusions on HRV and EEG monitoring may have limited generalizability in patients with other degrees of brain injury severity. As ECG and EEG monitoring are both widely used in patients with brain damage, we expect that large-scale studies on patients with varying severity of brain diseases are going to be conducted in the near future. Fourth, it is unclear why LH/HF ratio, SD2/ SD1 ratio, and ApEn showed different behaviors with certain EEG parameters in the correlation analysis. Although the HRV reliably reflects overall autonomic nervous function, it is unclear how the HRV parameters are able to explain the balance between sympathetic and parasympathetic activities. In particular, the LF/HF ratio and the SD2/SD1 ratio have been commonly used in many studies as markers of sympathetic activity, but the empirical evidence for such usage is lacking [47]. Therefore, we could not test the usefulness of HRV monitoring as a method for reflecting increased sympathetic activity following the increased intracranial pressure, particularly based on the “selfish brain” hypothesis [48].
In conclusion, we report that HRV parameters were associated with significant and progressive decreases in the 2-day period prior to neurological deterioration onset after severe acute brain injury. Combining HRV with EEG monitoring may facilitate timely detection of secondary brain damage progression before irreversible brain injury occurs.
KEY MESSAGES
▪ We examined the changes in heart rate variability (HRV) associated with continuous electroencephalography (EEG) parameters before and after neurological deterioration to examine whether HRV is capable of predicting secondary brain injury early-on.
▪ In patients who showed in-hospital mortality after severe acute brain injury, HRV parameters showed significant declines from the day before the neurological deterioration events commenced.
▪ Correlation analysis showed a significant association between HRV and EEG parameters, which may support the brain-heart network hypothesis.
NOTES
-
CONFLICT OF INTEREST
No potential conflict of interest relevant to this article was reported.
-
AUTHOR CONTRIBUTIONS
Conceptualization: all authors. Data curation: HL, SBJ. Formal analysis: HL. Methodology: all authors. Visualization & writing–original draft: HL. Writing–review & editing: all authors.
Acknowledgments
This study was supported by grants from the Korea Health Technology R&D Project through the Korea Health Industry Development Institute (KHIDI), funded by the Ministry of Health & Welfare, Republic of Korea (grant no. HI18C1487 and HI18C2383).
Figure 1.Changes in electroencephalography parameters over 2 days before (D–2 to D0) and after (D0 to D+2) neurological deterioration onset. (A) Suppression ratio (B) Asymmetry index. (C) Alpha/delta band power ratio. Values are presented as mean±standard deviation and were compared by Dunn’s pairwise tests after Kruskal-Wallis tests. *Statistically significant (P<0.01) differences compared with the value from the day before. Note that the monitoring was not conducted in D+2 in the non-survivors.

Figure 2.Changes in heart rate variability parameters over 2 days before (D–2 to D0) and after (D0 to D+2) neurological deterioration onset. (A) Standard deviations of the normal-normal intervals (SDNN). (B) Root mean square of successive normal-normal interval differences (RMSSD). (C) Log (VLF [very low frequency power]). (D) Low frequency/high frequency power ratio (LF/HF ratio). (E) Ratio of standard deviations along the transverse and longitudinal axis of the Poincaré plots (SD2/SD1 ratio). (F) Approximate entropy (ApEn). Values are presented as mean± standard deviation and were compared by Dunn’s pairwise tests after Kruskal-Wallis tests. *Statistically significant (P<0.01) differences compared with the value from the day before. Note that the monitoring was not conducted in D+2 in the non-survivors.

Figure 3.Heatmap of the correlation matrix between the electroencephalography and heart rate variability parameters. Results of the Spearman correlation rs (above the diagonal) and respective P-values for each correlation (below the diagonal). Darker shades of blue (value of 1.0) and red (value of –1.0) represent stronger correlation coefficients. IIC: ictal-interictal continuum; SDNN: standard deviations of the normal-normal intervals; RMSSD: root mean square of successive normal-normal interval differences; VLF: very low frequency power; LF: low frequency power; HF: high frequency power; SD2: standard deviations along the longitudinal axis of the Poincaré plots; SD1: standard deviations along the transverse axis of the Poincaré plots; ApEn: approximate entropy.
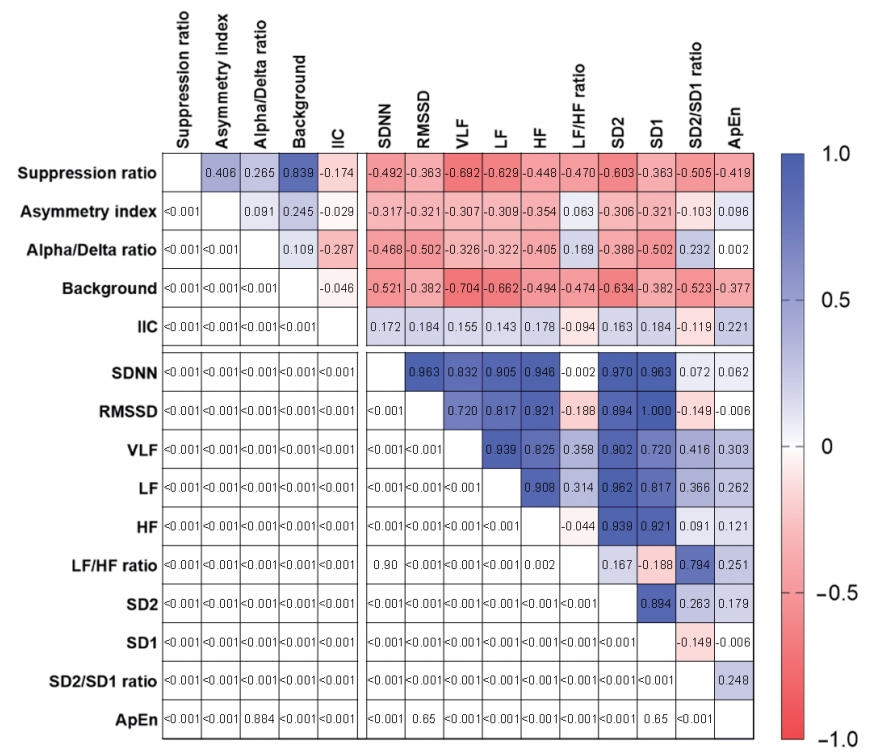
Table 1.Electroencephalography classification for analysis
|
Feature |
Abnormality |
Description |
|
Background |
I. normal/mild |
Predominant alpha to theta activity, normal or rudimentary N2 sleep transients (K complexes and/or sleep spindles) |
|
II. moderate |
Predominant delta activity and absent N2 sleep transients |
|
III. severe |
Burst-attenuation, burst-suppression, or suppression |
|
Ictal-interictal continuum |
I. normal |
None |
|
II. mild |
GRDA |
|
III. moderate |
Slower frequency (<1.5 Hz) LRDA or GPDs |
|
IV. severe |
Faster frequency (≥1.5 Hz) LRDA or GPDs, LPDs or ESz |
Table 2.Demographic and clinical characteristics of 25 patients who experienced neurological deterioration after severe brain injury
|
Characteristics |
All patients (n=25) |
Non-survivor (n=16) |
Survivor (n=9) |
P-value |
|
Patient demographics |
|
|
|
|
|
Male sex |
10 (40) |
5 (31) |
5 (56) |
0.44a
|
|
Age (yr) |
49.2±14.4 |
52.4±13.6 |
43.7±14.3 |
0.16b
|
|
Hypertension |
9 (36) |
5 (31) |
5 (56) |
>0.99a
|
|
Diabetes mellitus |
4 (16) |
2 (13) |
2 (22) |
0.95a
|
|
Clinical characteristics at the start of monitoring |
|
|
|
|
|
Glasgow Coma Scale score |
3 (3–6) |
3 (3–6) |
6 (3–7) |
0.88c
|
|
Intubation |
22 (88) |
14 (88) |
8 (89) |
>0.99a
|
|
Clinical seizure |
14 (56) |
9 (56) |
5 (56) |
>0.99a
|
|
Medication during the monitoring |
|
|
|
|
|
Remifentanil |
7 (28) |
5 (31) |
2 (22) |
0.99a
|
|
Dexmedetomidine |
3 (12) |
2 (13) |
1 (11) |
>0.99a
|
|
Propofol |
10 (40) |
6 (38) |
4 (45) |
>0.99a
|
|
Midazolam |
7 (28) |
6 (38) |
1 (11) |
0.34a
|
|
Ketamine |
2 (8) |
1 (6.2) |
1 (11) |
>0.99a
|
|
Epinephrine |
6 (24) |
5 (31) |
1 (11) |
0.52a
|
|
Norepinephrine |
14 (56) |
13 (81) |
1 (11) |
<0.01a
|
|
Non-sedating antiseizure drug |
22 (88) |
14 (88) |
8 (89) |
>0.99a
|
|
Mannitol |
16 (64) |
10 (63) |
6 (67) |
>0.99a
|
|
Etiology |
|
|
|
|
|
Hyperammonemia |
9 (36) |
4 (25) |
5 (56) |
0.27a
|
|
Meningoencephalitis |
6 (24) |
5 (31) |
1 (11) |
0.52a
|
|
Stroke |
6 (24) |
4 (25) |
2 (22) |
>0.99a
|
|
Traumatic brain injury |
3 (8) |
2 (13) |
1 (11) |
>0.99a
|
|
Lymphoma |
1 (4) |
1 (6.3) |
0 |
>0.99a
|
References
- 1. Geurts M, Macleod MR, van Thiel GJ, van Gijn J, Kappelle LJ, van der Worp HB. End-of-life decisions in patients with severe acute brain injury. Lancet Neurol 2014;13:515-24.ArticlePubMed
- 2. Stevens RD, Sutter R. Prognosis in severe brain injury. Crit Care Med 2013;41:1104-23.ArticlePubMed
- 3. Le Roux P, Menon DK, Citerio G, Vespa P, Bader MK, Brophy G, et al. The International Multidisciplinary Consensus Conference on Multimodality Monitoring in Neurocritical Care: a list of recommendations and additional conclusions: a statement for healthcare professionals from the Neurocritical Care Society and the European Society of Intensive Care Medicine. Neurocrit Care 2014;21 Suppl 2(Suppl 2):S282-96.
- 4. Hossmann KA. Viability thresholds and the penumbra of focal ischemia. Ann Neurol 1994;36:557-65.ArticlePubMed
- 5. Herman ST, Abend NS, Bleck TP, Chapman KE, Drislane FW, Emerson RG, et al. Consensus statement on continuous EEG in critically ill adults and children, part I: indications. J Clin Neurophysiol 2015;32:87-95.ArticlePubMedPMC
- 6. Foreman B, Claassen J. Quantitative EEG for the detection of brain ischemia. In: Vincent JL. In: Annual update in intensive care and emergency medicine 2012. Berlin, Heidelberg, Springer Berlin Heidelberg. 2012, pp 746-58.
- 7. Heart rate variability. Standards of measurement, physiological interpretation, and clinical use. Task Force of the European Society of Cardiology and the North American Society of Pacing and Electrophysiology. Eur Heart J 1996;17:354-81.PubMed
- 8. de Castilho FM, Ribeiro ALP, Nobre V, Barros G, de Sousa MR. Heart rate variability as predictor of mortality in sepsis: a systematic review. PLoS One 2018;13:e0203487.ArticlePubMedPMC
- 9. Karmali SN, Sciusco A, May SM, Ackland GL. Heart rate variability in critical care medicine: a systematic review. Intensive Care Med Exp 2017;5:33. ArticlePubMedPMC
- 10. Admiraal MM, Gilmore EJ, Van Putten MJ, Zaveri HP, Hirsch LJ, Gaspard N. Disruption of brain-heart coupling in sepsis. J Clin Neurophysiol 2017;34:413-20.ArticlePubMed
- 11. Cooke WH, Salinas J, Convertino VA, Ludwig DA, Hinds D, Duke JH, et al. Heart rate variability and its association with mortality in prehospital trauma patients. J Trauma 2006;60:363-70.ArticlePubMed
- 12. Grogan EL, Morris JA Jr, Norris PR, France DJ, Ozdas A, Stiles RA, et al. Reduced heart rate volatility: an early predictor of death in trauma patients. Ann Surg 2004;240:547-54.PubMedPMC
- 13. Hendén PL, Söndergaard S, Rydenhag B, Reinsfelt B, Ricksten SE, Aneman A. Can baroreflex sensitivity and heart rate variability predict late neurological outcome in patients with traumatic brain injury? J Neurosurg Anesthesiol 2014;26:50-9.ArticlePubMed
- 14. Rapenne T, Moreau D, Lenfant F, Vernet M, Boggio V, Cottin Y, Freysz M. Could heart rate variability predict outcome in patients with severe head injury? A pilot study. J Neurosurg Anesthesiol 2001;13:260-8.PubMed
- 15. Baillard C, Vivien B, Mansier P, Mangin L, Jasson S, Riou B, et al. Brain death assessment using instant spectral analysis of heart rate variability. Crit Care Med 2002;30:306-10.ArticlePubMed
- 16. Conci F, Di Rienzo M, Castiglioni P. Blood pressure and heart rate variability and baroreflex sensitivity before and after brain death. J Neurol Neurosurg Psychiatry 2001;71:621-31.ArticlePubMedPMC
- 17. Hirsch LJ, LaRoche SM, Gaspard N, Gerard E, Svoronos A, Herman ST, et al. American Clinical Neurophysiology Society’s Standardized Critical Care EEG Terminology: 2012 version. J Clin Neurophysiol 2013;30:1-27.ArticlePubMed
- 18. Lee H, Mizrahi MA, Hartings JA, Sharma S, Pahren L, Ngwenya LB, et al. Continuous electroencephalography after moderate to severe traumatic brain injury. Crit Care Med 2019;47:574-582.ArticlePubMedPMC
- 19. Rodriguez Ruiz A, Vlachy J, Lee JW, Gilmore EJ, Ayer T, Haider HA, et al. Association of periodic and rhythmic electroencephalographic patterns with seizures in critically Ill patients. JAMA Neurol 2017;74:181-8.ArticlePubMed
- 20. Megjhani M, Kaffashi F, Terilli K, Alkhachroum A, Esmaeili B, Doyle KW, et al. Heart rate variability as a biomarker of neurocardiogenic injury after subarachnoid hemorrhage. Neurocrit Care 2020;32:162-71.ArticlePubMedPMC
- 21. Goulding RM, Stevenson NJ, Murray DM, Livingstone V, Filan PM, Boylan GB. Heart rate variability in hypoxic ischemic encephalopathy: correlation with EEG grade and 2-y neurodevelopmental outcome. Pediatr Res 2015;77:681-7.ArticlePubMed
- 22. Vergales BD, Zanelli SA, Matsumoto JA, Goodkin HP, Lake DE, Moorman JR, et al. Depressed heart rate variability is associated with abnormal EEG, MRI, and death in neonates with hypoxic ischemic encephalopathy. Am J Perinatol 2014;31:855-62.ArticlePubMed
- 23. Beniczky S, Hirsch LJ, Kaplan PW, Pressler R, Bauer G, Aurlien H, et al. Unified EEG terminology and criteria for nonconvulsive status epilepticus. Epilepsia 2013;54 Suppl 6:28-9.ArticlePubMed
- 24. Rosenthal ES, Biswal S, Zafar SF, O’Connor KL, Bechek S, Shenoy AV, et al. Continuous electroencephalography predicts delayed cerebral ischemia after subarachnoid hemorrhage: a prospective study of diagnostic accuracy. Ann Neurol 2018;83:958-69.ArticlePubMedPMC
- 25. Claassen J, Hirsch LJ, Kreiter KT, Du EY, Connolly ES, Emerson RG, et al. Quantitative continuous EEG for detecting delayed cerebral ischemia in patients with poor-grade subarachnoid hemorrhage. Clin Neurophysiol 2004;115:2699-710.ArticlePubMed
- 26. Gollwitzer S, Groemer T, Rampp S, Hagge M, Olmes D, Huttner HB, et al. Early prediction of delayed cerebral ischemia in subarachnoid hemorrhage based on quantitative EEG: a prospective study in adults. Clin Neurophysiol 2015;126:1514-23.ArticlePubMed
- 27. Foreman B, Albers D, Schmidt JM, Falo CM, Velasquez A, Connolly ES, et al. Intracortical electrophysiological correlates of blood flow after severe SAH: a multimodality monitoring study. J Cereb Blood Flow Metab 2018;38:506-17.ArticlePubMed
- 28. Carrasco S, Gaitán MJ, González R, Yánez O. Correlation among Poincaré plot indexes and time and frequency domain measures of heart rate variability. J Med Eng Technol 2001;25:240-8.PubMed
- 29. Counihan PJ, Fei L, Bashir Y, Farrell TG, Haywood GA, McKenna WJ. Assessment of heart rate variability in hypertrophic cardiomyopathy: association with clinical and prognostic features. Circulation 1993;88(4 Pt 1):1682-90.ArticlePubMed
- 30. Fontolliet T, Gianella P, Pichot V, Barthélémy JC, Gasche-Soccal P, Ferretti G, et al. Heart rate variability and baroreflex sensitivity in bilateral lung transplant recipients. Clin Physiol Funct Imaging 2018;38:872-80.ArticlePubMed
- 31. Tibby SM, Frndova H, Durward A, Cox PN. Novel method to quantify loss of heart rate variability in pediatric multiple organ failure. Crit Care Med 2003;31:2059-67.ArticlePubMed
- 32. Swor DE, Thomas LF, Maas MB, Grimaldi D, Manno EM, Sorond FA, et al. Admission heart rate variability is associated with fever development in patients with intracerebral hemorrhage. Neurocrit Care 2019;30:244-50.ArticlePubMedPMC
- 33. Sykora M, Czosnyka M, Liu X, Donnelly J, Nasr N, Diedler J, et al. Autonomic impairment in severe traumatic brain injury: a multimodal neuromonitoring study. Crit Care Med 2016;44:1173-81.ArticlePubMed
- 34. Mowery NT, Norris PR, Riordan W, Jenkins JM, Williams AE, Morris JA Jr. Cardiac uncoupling and heart rate variability are associated with intracranial hypertension and mortality: a study of 145 trauma patients with continuous monitoring. J Trauma 2008;65:621-7.ArticlePubMed
- 35. Biswas AK, Scott WA, Sommerauer JF, Luckett PM. Heart rate variability after acute traumatic brain injury in children. Crit Care Med 2000;28:3907-12.ArticlePubMed
- 36. Naver HK, Blomstrand C, Wallin BG. Reduced heart rate variability after right-sided stroke. Stroke 1996;27:247-51.ArticlePubMed
- 37. Wang YM, Wu HT, Huang EY, Kou YR, Hseu SS. Heart rate variability is associated with survival in patients with brain metastasis: a preliminary report. Biomed Res Int 2013;2013:503421. ArticlePubMedPMC
- 38. Papaioannou V, Giannakou M, Maglaveras N, Sofianos E, Giala M. Investigation of heart rate and blood pressure variability, baroreflex sensitivity, and approximate entropy in acute brain injury patients. J Crit Care 2008;23:380-6.ArticlePubMed
- 39. Haji-Michael PG, Vincent JL, Degaute JP, van de Borne P. Power spectral analysis of cardiovascular variability in critically ill neurosurgical patients. Crit Care Med 2000;28:2578-83.ArticlePubMed
- 40. Piantino JA, Lin A, Crowder D, Williams CN, Perez-Alday E, Tereshchenko LG, et al. Early heart rate variability and electroencephalographic abnormalities in acutely brain-injured children who progress to brain death. Pediatr Crit Care Med 2019;20:38-46.ArticlePubMedPMC
- 41. Machado C, Estevez M, Perez-Nellar J, Schiavi A. Residual vasomotor activity assessed by heart rate variability in a braindead case. BMJ Case Rep 2015;2015:bcr2014205677. ArticlePubMedPMC
- 42. Jurak P, Halamek J, Vondra V, Kruzliak P, Sramek V, Cundrle I, et al. Respiratory induced heart rate variability during slow mechanical ventilation: marker to exclude brain death patients. Wien Klin Wochenschr 2017;129:251-8.ArticlePubMed
- 43. Witsch J, Frey HP, Schmidt JM, Velazquez A, Falo CM, Reznik M, et al. Electroencephalographic periodic discharges and frequency-dependent brain tissue hypoxia in acute brain injury. JAMA Neurol 2017;74:301-9.ArticlePubMedPMC
- 44. Struck AF, Westover MB, Hall LT, Deck GM, Cole AJ, Rosenthal ES. Metabolic correlates of the ictal-interictal continuum: FDG-PET during continuous EEG. Neurocrit Care 2016;24:324-31.ArticlePubMedPMC
- 45. Vespa P, Tubi M, Claassen J, Buitrago-Blanco M, McArthur D, Velazquez AG, et al. Metabolic crisis occurs with seizures and periodic discharges after brain trauma. Ann Neurol 2016;79:579-90.ArticlePubMed
- 46. Moridani MK, Farhadi H. Heart rate variability as a biomarker for epilepsy seizure prediction. Bratisl Lek Listy 2017;118:3-8.ArticlePubMed
- 47. Billman GE. The LF/HF ratio does not accurately measure cardiac sympatho-vagal balance. Front Physiol 2013;4:26. ArticlePubMedPMC
- 48. Guild SJ, Saxena UA, McBryde FD, Malpas SC, Ramchandra R. Intracranial pressure influences the level of sympathetic tone. Am J Physiol Regul Integr Comp Physiol 2018;315:R1049-53.ArticlePubMed
Citations
Citations to this article as recorded by

- Association of Depressive and Somatic Symptoms with Heart Rate Variability in Patients with Traumatic Brain Injury
Seung Don Yoo, Eo Jin Park
Journal of Clinical Medicine.2022; 12(1): 104. CrossRef - Influencing Cardiovascular Outcomes through Heart Rate Variability Modulation: A Systematic Review
Alexandru Burlacu, Crischentian Brinza, Iolanda Valentina Popa, Adrian Covic, Mariana Floria
Diagnostics.2021; 11(12): 2198. CrossRef

 , Sang-Beom Jeon1

 PubReader
 ePub Link
 Cite
Cite