Lund and Browder chart—modified versus original: a comparative study
Article information

Abstract
Background
The Lund and Browder (LB) chart is currently the most accurate and widely used chart to calculate total body surface area affected by a burn injury. However, it is not easy to use charts to calculate burn percentages because of the difficulty in performing mathematical calculations with the percentages attributed to various body regions that are only partially burned. It is also cumbersome to have to perform mental calculations, especially in emergency situations.
Methods
We compared results from the LB chart with a modified Lund and Browder (MLB) chart using 10 assessors on five different burn wounds each drawn on both charts.
Results
Variability of results was significantly reduced using the MLB chart compared to the LB chart.
Conclusions
Assessments performed using the MLB chart are less variable than those using the LB chart. Using this chart will help burn care providers rapidly, accurately, and reliably estimate burn extent.
INTRODUCTION
Determination of the percentage of total body surface area (BSA) involved in a burn injury is important, as this value is used for fluid resuscitation, transfer decisions, further management, prognosis, and research. Common methods of estimation of burned BSA are patient palm method, rule of nines, and the Lund and Browder (LB) chart. Computerized methods of burn size estimation are also available using planimetry [1], three-dimensional photography [2], and smart phone applications [3] and these are reported to be very accurate but have not yet found wide acceptance. There can be considerable variation among observers in assessing the same burn wound [4], and overestimations are common and can lead to fluid overload and further incorrect management decisions.
The patient palm method can lead to overestimations of 10% to 20% [5] as area of the palmar surface of the adult hand corresponds to 0.78% of the BSA [6]. This is also an inconvenient method to use for larger burns. The rules of nine method, published by Wallace in 1951 [7] as a simplification of measurements performed by Berkow in 1924 [8], is in common usage though overestimations are reported, especially in persons with high body mass index [5]. To overcome this, a “rule of five” for persons >80 kg and a “rule of eight” for infants weighing <10 kg have been proposed [9].
Even though the LB chart (Figure 1) [10] is considered the most accurate of these three methods, it is still prone to errors [11]. Using the LB chart itself is not easy, especially in emergency situations [10]. Estimates have to be made and mental calculations have to be performed, usually involving fractions, and can results in miscalculation. Results may vary significantly among observers [4], and this variability is inversely proportional to accuracy. From the first responder to specialists, assessment of burn area may have to be conducted multiple times and by people with varying degrees of training and experience. The method used for this assessment must be as robust, precise, reliable, and repeatable as possible.
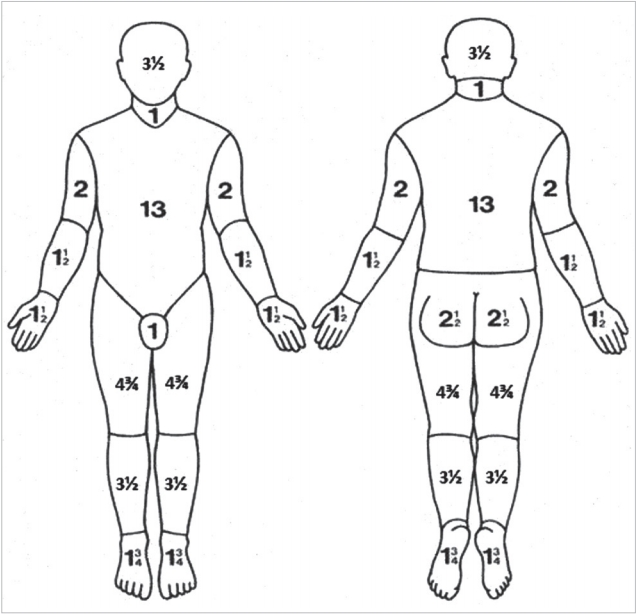
Lund and Browder chart. Modified from Wikipedia Contributors [10].
The LB chart has been modified (Figure 2) [12] to allow more reliable and easier to perform calculations. The purpose of this study is to achieve a more consistent and easier method of calculating burn percentages especially when used by multiple assessors with different levels of training.
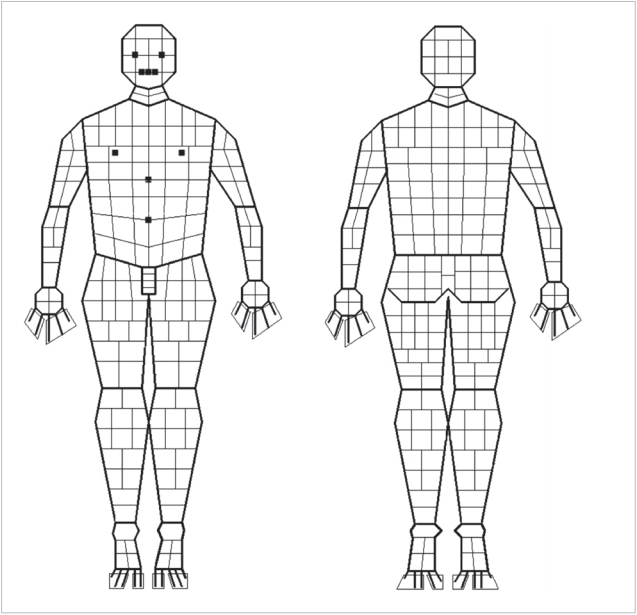
Modified Lund and Browder chart.
MATERIALS AND METHODS
The process of calculating BSA burned using charts involves three stages. First is inspecting the burn in the three-dimensional patient; second is transcribing that burn area onto a two-dimensional chart, and third is calculating the BSA burned based on the chart rules. Our experiment was deliberately simple and confined only to the third stage to determine which chart produces more consistent results.
The LB chart (Figure 1) consists of two outline drawings of the human body, anterior and posterior [13]. Major divisions of the body are demarcated by lines, and standard percentages of each part are indicated. The assessor draws an outline of the burn wound on the anterior and posterior body diagrams, calculates the burn area in each region, and then sums the area to obtain the body percentage of the burn wound. For children, the head, thigh, and leg percentages vary with age and are designated as A, B, and C, respectively. These variable percentages are listed according to age in a separate table.
The MLB chart (adult use only) used in this study (Figure 2) [12] was designed by the first author using the open source program (GNU Image Manipulation Program). In this modified chart, each region is subdivided into smaller areas such that each quadrilateral shape represents one-quarter of 1% (0.25%). Area-wise percentages of each region of the LB chart were not changed (Figure 3). As in the LB chart, the assessor colors in or outlines the burned area. The number of shaded quadrilaterals is counted and divided by four to arrive at the total percentage of BSA burned.
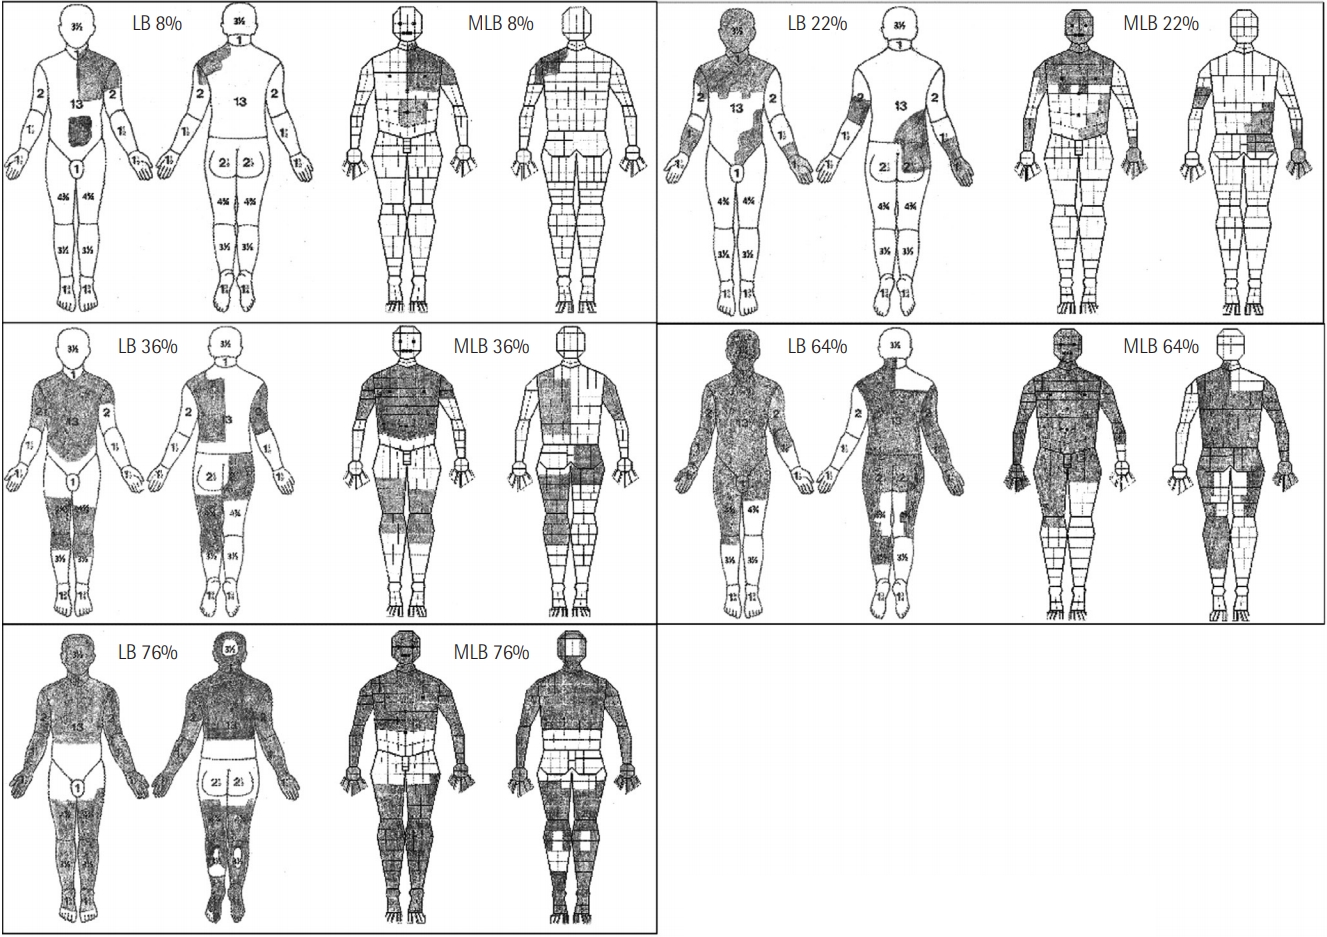
Preshaded burn charts.
Five burn wounds of increasing percentage area (approximately 8%, 22%, 36%, 64%, and 76%) were shaded onto blank LB and MLB charts. Ten copies of each chart were prepared, giving a total of 100 charts. The charts were then administered randomly to 10 medical interns who had been briefed about the use of both charts before the experiment. The interns were asked to calculate the burn percentage indicated on the charts. We used their results to compare the reliability of calculations for each chart and to ascertain if this reliability was maintained over a range of burn wound sizes.
Results were analyzed, and descriptive data (mean, median, mode, standard deviation, and variance) were calculated using Microsoft Excel 2013 (Microsoft, Redmond, WA, USA). A two-sample t-test was conducted to show the statistical significance of differences in mean and variance between the two sets of estimates. At the end of the session, the interns were asked which chart was easier to complete.
RESULTS
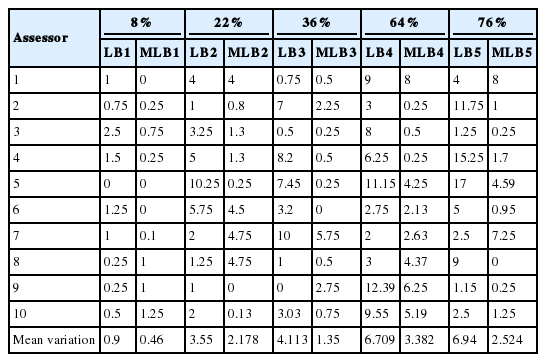
The percentages calculated for similar burns on the two charts are shown in Table 1. The absolute differences between the calculated and real burn percentages using the two charts are given in Table 2. Figure 4 shows that the average variation from the real value is lower in all cases with the MLB chart compared to the LB chart. The percentage variation was significantly lower using the MLB chart compared with the LB chart (Table 3).
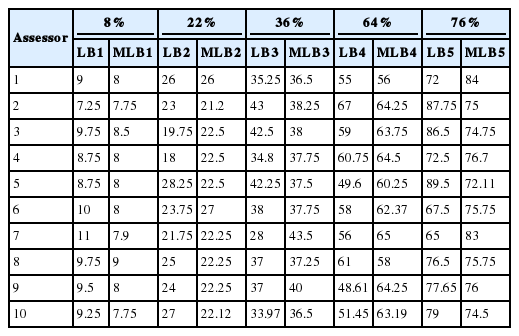
Percentages assessed by 10 assessors for the five different burn sizes
Variation from the real value
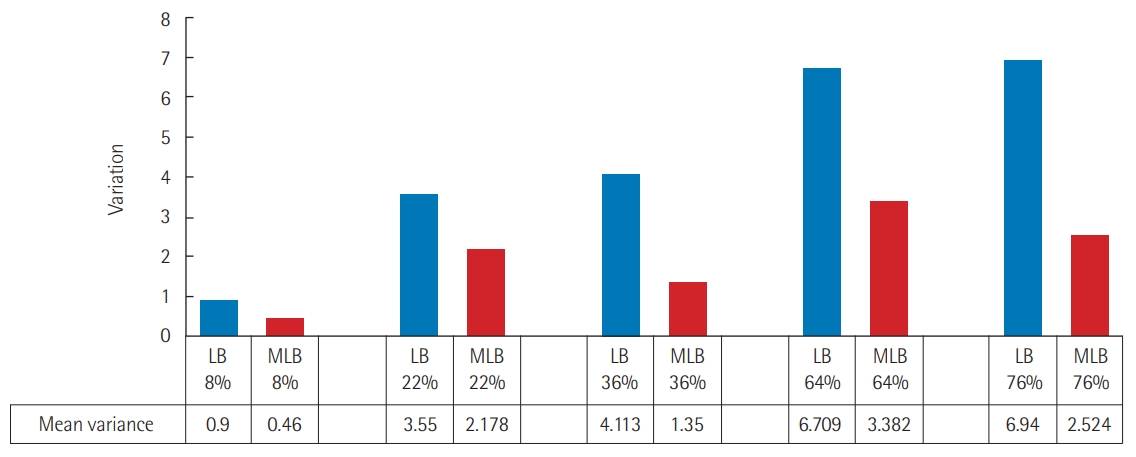
Mean variation from real value. LB: Lund and Browder; MLB: modified Lund and Browder.
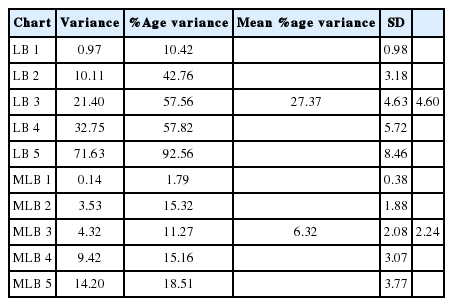
Variance statistics
There was a significant decrease in the variability of BSA assessments of a burn wound drawn on the MLB chart compared to those on the LB chart (Table 4). The difference in mean absolute difference between LB (4.54) and MLB charts (1.67) shows that the MLB chart clearly produced more consistent results than the LB chart. All assessors noted that the MLB chart was easier to use than the LB chart.
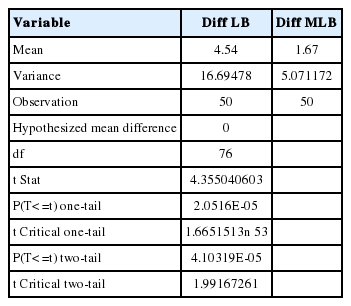
Results of a two-sample t-test assuming unequal variances
DISCUSSION
Our results show that results are significantly more consistent when assessors calculate burn percentage using the MLB chart compared to the LB chart. Assessors were uniform in their preference for the MLB chart due to its ease of calculation. This consistency is because BSA is broken down into smaller measurable units, and there is no need to perform mental estimates or calculations with fractions. The MLB chart is a refinement of the LB chart and has a resolution of 0.25%.
Despite its popularity, the LB chart method is vulnerable to a number of errors [14]. Most depictions of the chart available on the internet sum to 101%. This anomaly has been succinctly explained by Lundin and Alsbjørn [15] to be probably due to a typing error made before this seminal chart was widely distributed over the Internet. One side of each hand is 1.25% in the original instead of the commonly depicted 1.5%.
Mistakes in assessment using the LB chart may involve the assessor (inaccurate shading of burned areas on the chart, incorrect calculations), the instrument (need to calculate in fractions, difficulty in portraying lateral areas of the body), or the patient (obesity, breast hypertrophy, amputation, etc.). Our aim was to improve the tool of measurement so that calculation is easier, variability is decreased, and accuracy is increased.
Burns are usually irregular in shape and may involve more or less than a single region as demarcated on the LB chart. Thus, the assessor must estimate the burned area in a particular region and then subtract this estimate from the total for that region to arrive at the percentage for that particular area. Many of these regional percentages are represented as fractions. This procedure has to be repeated for all affected regions and the total then calculated. Emergency situations are not conducive to accurate mathematical thinking, and errors can arise due to such miscalculations [10]. Each time the assessor performs estimation and calculation, there is potential for error.
In the MLB chart, once the burn area is indicated, counting of squares and division by four is easy and requires no processing of fractions. This calculation can usually be conducted mentally and the result obtained can be easily cross- and counterchecked. While the LB chart has variants to accurately calculate burned areas in children, the MLB chart is only suitable for adults. Further work needs to be address childhood variants of the MLB chart.
HIGHLIGHTS
■ Calculating burn percentages using the Lund and Browder (LB) chart involves dividing and counting in fractions, which can be difficult.
■ The modified LB chart presented here subdivides each chart region of the body into quadrilaterals of 0.25% each.
■ This subdivision makes calculations much easier and more reliable as the number of shaded quadrilaterals has only to be counted and divided by 4 to determine the total burn area.
Notes
CONFLICT OF INTEREST
No potential conflict of interest relevant to this article was reported.
AUTHOR CONTRIBUTIONS
Conceptualization & Data curation: AM. Formal analysis: KNS. Methodology, Project administration, Visualization, and Writing - original draft, review & editing: AM.