
Articles
- Page Path
- HOME > Acute Crit Care > Volume 37(3); 2022 > Article
-
Original Article
Neurology Cytokine profiles in intensive care unit delirium -
Ryan J. Smith1
 , Christian Lachner2, Vijay P. Singh3, Shubham Trivedi4, Biswajit Khatua4, Rodrigo Cartin-Ceba5,6
 -
Acute and Critical Care 2022;37(3):415-428.
DOI: https://doi.org/10.4266/acc.2021.01508
Published online: June 20, 2022
1Mayo Clinic School of Graduate Medical Education, Department of Internal Medicine, Mayo Clinic, Rochester, MN, USA
2Division of Psychiatry, Department of Neurology, Mayo Clinic Florida, Jacksonville, FL, USA
3Division of Gastroenterology and Hepatology, Mayo Clinic Arizona, Phoenix, AZ, USA
4Department of Gastroenterology and Hepatology, Mayo Clinic, Rochester, MN, USA
5Department of Critical Care Medicine, Mayo Clinic Arizona, Phoenix, AZ, USA
6Division of Pulmonary Medicine, Mayo Clinic Arizona, Phoenix, AZ, USA
- Corresponding author: Rodrigo Cartin-Ceba Department of Critical Care Medicine and Division of Pulmonary Medicine, Mayo Clinic Arizona, 5777 East Mayo Boulevard, Phoenix, AZ 85054, USA Tel: +1-6025385003, E-mail: cartinceba.rodrigo@mayo.edu
Copyright © 2022 The Korean Society of Critical Care Medicine
This is an Open Access article distributed under the terms of the Creative Commons Attribution Non-Commercial License (http://creativecommons.org/licenses/by-nc/4.0/) which permits unrestricted non-commercial use, distribution, and reproduction in any medium, provided the original work is properly cited.
Abstract
-
Background
- Neuroinflammation causing disruption of the blood-brain barrier and immune cell extravasation into the brain parenchyma may cause delirium; however, knowledge of the exact pathophysiologic mechanism remains incomplete. The purpose of our study was to determine whether cytokine profiles differ depending on whether delirium occurs in the setting of sepsis, coronavirus disease 2019 (COVID-19), or recent surgery.
-
Methods
- This prospective observational cohort study involved 119 critically ill patients admitted to a multidisciplinary intensive care unit (ICU) during 2019 and 2020. Delirium was identified using the validated confusion assessment method for the ICU. Multiple delirium risk factors were collected daily including clinical characteristics, hospital course, lab values, vital signs, surgical exposure, drug exposure, and COVID-19 characteristics. Serums samples were collected within 12 hours of ICU admission and cytokine levels were measured.
-
Results:
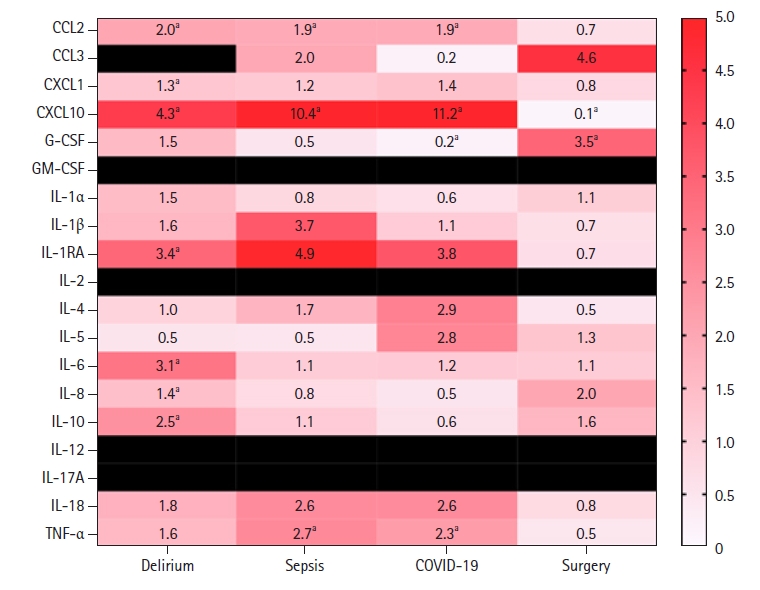
- The following proinflammatory cytokines were elevated in our delirium population: tumor necrosis factor (TNF)-α, interleukin (IL)-6, IL-18, C-C motif ligand (CCL) 2, CCL3, C-X-C motif chemokine ligand (CXCL)1, CXCL10, IL-8, IL-1 receptor antagonist, and IL-10. Analysis of relative cytokine levels in those patients that developed delirium in the setting of sepsis, COVID-19, and recent surgery showed elevations of CCL2, CXCL10, and TNF-α in both the sepsis and COVID-19 group in comparison to the postsurgical population. In the postsurgical group, granulocyte colony-stimulating factor was elevated and CXCL10 was decreased relative to the opposing groups.
-
Conclusions
- We identify several cytokines and precipitating factors known to be associated with delirium. However, our study suggests that the cytokine profile associated with delirium is variable and contingent upon delirium precipitating factors.
INTRODUCTION
METHODS
RESULTS
DISCUSSION
HIGHLIGHTS
-
CONFLICT OF INTEREST No potential conflict of interest relevant to this article was reported.
-
AUTHOR CONTRIBUTIONS
Conceptualization: RJS, CL, RCC. Data curation: VPS, ST, BK. Formal analysis: RJS. Methodology: RCC. Project administration: VPS, RCC. Writing–original draft: RJS. Writing–review & editing: CL, VPS, RCC.
NOTES
| Variable | Total cohort | No delirium (n=78) | Delirium (n=41) | P-value |
|---|---|---|---|---|
| Patient characteristics | ||||
| Age (yr) | 64 (50–75) | 66.6 (55.8–75) | 55 (46.5–69.5) | 0.01a |
| Female | 40 (33.6) | 24 (30.8) | 16 (39) | 0.42 |
| APS score | 45 (31–59) | 38 (26.8–48.3) | 59 (40–84.5) | <0.001a |
| APACHE IV score | 56 (39–75) | 53 (37.5–65.3) | 79 (52–98.5) | <0.001a |
| Prior history of CVA (ischemic stroke) | 8 (6.7) | 4 (5.1) | 4 (9.8) | 0.44 |
| Prior history of hemorrhagic stroke | 3 (2.5) | 1 (1.3) | 2 (4.9) | 0.27 |
| Prior history of TBI | 3 (2.5) | 2 (2.6) | 1 (2.4) | 1.00 |
| Pre-existing cognitive impairment | 2 (1.7) | 1 (1.3) | 1 (2.4) | 1.00 |
| BMI (kg/m2) | 28.9 (25–33.5) | 28.5 (24.9–33.8) | 28.9 (25.7–32.7) | 0.78 |
| Code status (full code) | 118 (99.2) | 77 (98.7) | 41 (100) | 1.00 |
| DM | 47 (39.5) | 30 (38.5) | 17 (41.5) | 0.84 |
| HTN | 51 (42.9) | 34 (43.6) | 17 (41.5) | 0.85 |
| CAD | 33 (27.7) | 25 (32.1) | 8 (19.5) | 0.20 |
| Cancer | 14 (11.8) | 11 (14.1) | 3 (7.3) | 0.38 |
| CKD | 17 (14.3) | 13 (16.7) | 4 (9.8) | 0.41 |
| ESRD | 3 (2.5) | 3 (3.9) | 0 | 0.55 |
| Cirrhosis | 7 (5.9) | 6 (7.7) | 1 (2.4) | 0.42 |
| Hepatic failure | 1 (0.84) | 1 (1.3) | 0 | 1.00 |
| Metastatic carcinoma | 3 (2.5) | 1 (1.3) | 2 (4.9) | 0.27 |
| Leukemia/myeloma | 3 (2.5) | 3 (3.9) | 0 | 0.55 |
| Immunosuppression | 14 (11.8) | 6 (7.7) | 8 (19.5) | 0.07 |
| Trauma | 1 (0.8) | 1 (1.3) | 0 | 1.00 |
| Hospital course | ||||
| ICU LOS (day) | 3.3 (1.9–10.4) | 2.2 (1.3–4.0) | 14.5 (3.7–33.2) | <0.001a |
| Hospital LOS (day) | 9.9 (1.1–10.4) | 7.1 (5.0–10.9) | 23.2 (16.8–40.2) | <0.001a |
| ICU mortality | 12 (10.1) | 7 (9.0) | 5 (12.2) | 0.75 |
| Hospital mortality | 13 (10.9) | 7 (9.0) | 6 (14.6) | 0.37 |
| Sepsis | 66 (55.5) | 37 (47.4) | 29 (70.7) | 0.02a |
| Septic shock | 37 (31.1) | 19 (24.4) | 18 (43.9) | 0.04a |
| Sepsis or septic shock | 66 (55.5) | 37 (47.4) | 29 (70.7) | 0.02a |
| COVID-19 | 38 (31.9) | 18 (23.1) | 20 (48.8) | 0.007a |
| 28-Day mortality | 13 (10.9) | 7 (9.0) | 6 (14.6) | 0.37 |
| GCS | 15 (10–15) | 15 (11.8–15) | 11 (3–15) | <0.001a |
| Pre-ICU day | 1 (0–2) | 0 (0–2) | 1 (0–2) | 0.47 |
| Emergency surgery | 5 (4.2) | 3 (3.9) | 2 (4.9) | 1.00 |
| Thrombolysis | 5 (4.2) | 4 (5.1) | 1 (2.4) | 0.66 |
| CRRT | 17 (14.3) | 5 (6.4) | 12 (29.3) | <0.01a |
| ECMO | 11 (9.2) | 1 (1.3) | 10 (24.4) | <0.001a |
| LVAD | 1 (0.8) | 0 | 1 (2.4) | 0.34 |
| RVAD | 1 (0.8) | 0 | 1 (2.4) | 0.34 |
| Labs & vitals | ||||
| Positive culture | 27 (22.7) | 15 (19.2) | 12 (29.3) | 0.25 |
| Initial lactate (mmol/L) | 1.5 (1.1–3) | 1.4 (1.1–2.8) | 1.7 (1.1–3.7) | 0.32 |
| Highest lactate (mmol/L) | 1.8 (1.1–3.8) | 1.7 (1.1–3.6) | 1.9 (1.3–3.8) | 0.34 |
| Lactate clearance (mmol/L) | 1.6 (1.3–2.9) | 1.6 (1.3–2.8) | 2.2 (1.4–3.1) | 0.36 |
| Ionized calcium (mg/dL) | 4.5 (4.2–4.7) | 4.5 (4.3–4.8) | 4.4 (4.2–4.6) | 0.36 |
| Calcium (mg/dl) | 8.2 (7.8–8.7) | 8.3 (7.8–8.8) | 8.1 (7.5–8.4) | 0.07 |
| Temperature (°C) | 37.5 (36.7–38.4) | 37.5 (36.7–38.5) | 37.3 (36.8–38.1) | 0.46 |
| MAP (mm Hg) | 62.0 (58.0–70.0) | 61.0 (56.0–67.8) | 64 (58.5–71.5) | 0.22 |
| HR (beats/min) | 98.0 (88.0–111.0) | 97.5 (86.8–108.0) | 101.0 (90.0–118.0) | 0.09 |
| RR (/min) | 25.0 (20.0–29.0) | 24.0 (20.0–29.0) | 27.0 (22.5–32.0) | 0.08 |
| MV | 64 (53.8) | 36 (46.2) | 28 (68.3) | 0.03a |
| FiO2(%) | 50 (40–70) | 50 (32–60) | 70 (50–100) | <0.001a |
| PaO2 (mm Hg) | 90 (77–111) | 90 (80–121) | 87 (72–105) | 0.22 |
| PaCO2 (mm Hg) | 36 (31–40) | 36 (32–40) | 37 (31–44) | 0.19 |
| Arterial pH | 7.40 (7.34–7.43) | 7.40 (7.36–7.44) | 7.36 (7.27–7.43) | 0.01a |
| Na+ (mmol/L) | 138.0 (134.0–141.0) | 138.5 (135.6–141.0) | 136.0 (132.5–140.0) | 0.07 |
| Urine output (ml/24 hr) | 1,687.0 (1,160.0–2,385.0) | 1,640.5 (1,178.0–2,392.5) | 1,735.0 (977.5–2,387.5) | 0.95 |
| Creatinine (mg/dl) | 1.1 (0.8–1.7) | 1.1 (0.8–1.7) | 1.2 (0.7–2.0) | 0.49 |
| BUN (mg/dl) | 18.5 (13.0–28.0) | 16.6 (12.0–25.3) | 24.0 (13.5–38.0) | 0.05a |
| Glucose (mg/dl) | 151 (114–188) | 140.5 (110–174) | 168 (137–260) | <0.01a |
| Albumin (g/dl) | 3.5 (3.0–4.0) | 3.8 (3.2–4.0) | 3.3 (2.6–3.7) | <0.01a |
| Bilirubin (mg/dl) | 0.7 (0.4–1.0) | 0.7 (0.4–1.0) | 0.6 (0.3–1.1) | 0.53 |
| Hct (%) | 33.0 (27.9–37.7) | 33.8 (27.8–37.7) | 32.2 (27.1–38.3) | 0.79 |
| WBC (×109/L) | 10.0 (6.9–15.0) | 9.5 (6.7–13.1) | 11.4 (8.8–16.3) | 0.03a |
Values are presented as median (interquartile range) or number (%).
APS: Acute Physiology Score; APACHE: Acute Physiology and Chronic Health Evaluation; CVA: cerebrovascular accident; TBI: traumatic brain injury; BMI: body mass index; DM: diabetes mellitus; HTN: hypertension; CAD: coronary artery disease; CKD: chronic kidney disease; ESRD: end stage renal disease; ICU: intensive care unit; LOS: length of stay; COVID-19: coronavirus disease-19; GCS: Glasgow coma scale; CRRT: continuous renal replacement therapy; ECMO: extracorporeal membrane oxygenation; LVAD: left ventricular assist device; RVAD: right ventricular assist device; MAP: mean arterial pressure; HR: heart rate; RR: respiration rate; MV: mechanical ventilation; FiO2: fraction of inspired oxygen; PaO2: partial pressure of oxygen; PaCO2: partial pressure of carbon dioxide; BUN: blood urea nitrogen; Hct: hematocrit; WBC: white blood cell.
a P≤0.05.
| Variable | Total cohort | No delirium (n=78) | Delirium (n=41) | P-value |
|---|---|---|---|---|
| Recent surgery | 52 (43.7) | 41 (52.6) | 11 (26.8) | 0.01a |
| Total blood loss from all surgical procedures (ml) | 105 (100–450) | 103 (100–500) | 125 (100–300) | 0.96 |
| Total surgical time from all surgical procedures (min) | 304 (246.8–408.3) | 306 (250.5–396.0) | 284 (225.0–486.0) | 0.90 |
| Recent inhaled anesthetic | 54 (45.4) | 42 (53.9) | 12 (29.3) | 0.01a |
| Total duration of inhaled anesthesia from all surgical procedures (min) | 302 (234–415) | 304 (248–389) | 255 (207–517) | 0.83 |
| Variable | Total cohort | No delirium (n=78) | Delirium (n=41) | P-value |
|---|---|---|---|---|
| Benzodiazepine (in lorazepam equivalents) | ||||
| Diazepam | 17.0 (14.3) | 4.0 (5.1) | 13.0 (31.7) | <0.001a |
| Diazepam dose (mg) | 24.0 (9.0–43.5) | 10.0 (3.2–560.6) | 29.0 (14.5–43.5) | 0.34 |
| Midazolam | 83.0 (69.8) | 48.0 (61.5) | 35.0 (85.4) | 0.01a |
| Midazolam dose (mg) | 5.5 (3.0–256.0) | 3.7 (2.5–6.0) | 176.5 (7.5–1,049.4) | <0.001a |
| Lorazepam | 21.0 (17.7) | 15.0 (19.2) | 6.0 (14.6) | 0.62 |
| Lorazepam dose (mg) | 1.5 (0.5–2.5) | 1.5 (0.5–2.5) | 1.0 (0.8–21.3) | 1.00 |
| Alprazolam | 7.0 (5.9) | 6 (7.7) | 1.0 (2.4) | 0.42 |
| Alprazolam dose (mg) | 3.6 (1.0–5.0) | 3.8 (1.0–5.4) | 2.0 | 0.8 |
| Sedative | ||||
| Etomidate | 37 (31.1) | 23 (29.5) | 14 (31.2) | 0.68 |
| Etomidate dose (mg) | 20 (20–30) | 24 (20–30) | 20 (20–23) | 0.03a |
| Methocarbamol | 4 (3.4) | 2 (2.6) | 2 (4.9) | 0.61 |
| Methocarbamol dose (mg) | 7,000 (1,250–8,500) | 7,000 (2,000–7,000) | 5,250 (500–10,000) | 1.00 |
| Propofol | 62 (52.1) | 39 (50.0) | 23 (56.1) | 0.57 |
| Propofol dose (mg) | 453.8 (130.1–2,484.8) | 260.9 (120.0–1,012.0) | 1,000.0 (133.5–3,875.0) | 0.28 |
| Dexmedetomidine | 59 (49.6) | 33 (42.3) | 26 (63.4) | 0.03a |
| Dexmedetomidine dose (μg) | 774.0 (264.8–2,800.0) | 383.0 (158.0–806.2) | 2,800.0 (987.2–7,637.9) | <0.001a |
| Ketamine | 19 (16.0) | 7 (9.0) | 12 (29.3) | 0.01a |
| Ketamine dose (mg) | 1,294.9 (30.0–3,860.2) | 30.0 (10.0–3,841.6) | 2,915.4 (69.6–4,703.3) | 0.22 |
| Opioid (in morphine equivalents) | ||||
| Fentanyl | 98 (82.4) | 61 (78.2) | 37 (90.2) | 0.13 |
| Fentanyl dose (mg) | 152.5 (39.2–371.6) | 133.8 (28.1–196.9) | 351.1 (60.7–1,374) | <0.01a |
| Hydromorphone | 50 (42.0) | 29 (37.2) | 21 (51.2) | 0.17 |
| Hydromorphone dose (mg) | 18.2 (4.0–339.0) | 8.0 (4.0–66.6) | 322.7 (6.0–9,719.9) | 0.01a |
| Morphine | 18 (15.1) | 11 (14.1) | 7 (17.1) | 0.79 |
| Morphine dose (mg) | 8.5 (4.0–25.5) | 11 (4.0–18.0) | 6 (4.0–48.0) | 0.75 |
| Oxycodone | 45 (37.8) | 39 (50.0) | 6 (14.6) | <0.001a |
| Oxycodone dose (mg) | 97.5 (45.0–161.3) | 97.5 (45.0–165.0) | 45 (37.5–630.0) | 0.63 |
| Total morphine equivalents (mg) | 249 (102.1–797.7) | 235 (71.5–380.0) | 742 (151.8–3,700.3) | <0.01a |
| Antibiotics | ||||
| Cefazolin | 53 (44.5) | 41 (52.6) | 12 (29.3) | 0.02a |
| Cefazolin dose (g) | 12 (6–12) | 12 (7–12) | 9 (4–12) | 0.25 |
| Cefepime | 25 (21.0) | 12 (15.4) | 13 (31.7) | 0.06 |
| Cefepime dose (g) | 12 (4.3–23.0) | 9 (2.5–22.5) | 13 (7.3–32.0) | 0.39 |
| Vancomycin | 64 (53.8) | 33 (42.3) | 31 (75.6) | <0.001a |
| Vancomycin dose (g) | 3 (1.8–5.3) | 3 (1.8–5.6) | 3 (1.8–5.3) | 0.89 |
| Acyclovir | 2 (1.7) | 1 (1.3) | 1 (2.4) | 1.00 |
| Acyclovir dose (g) | 3.1 (1.4–4.8) | 1.4 | 4.8 | 1.00 |
| Azithromycin | 37 (31.1) | 18 (23.1) | 19 (46.3) | 0.01a |
| Azithromycin dose (g) | 1.5 (1.0–2.5) | 1.8 (1.4–2.5) | 1.5 (1–2.5) | 0.72 |
| Piperacillin | 53 (44.5) | 27 (34.6) | 26 (63.4) | <0.01a |
| Piperacillin dose (g) | 37.1 (20.3–91.7) | 37.1 (21.4–93.4) | 34.9 (16–72.6) | 0.55 |
| Ceftriaxone | 27 (22.7) | 20 (25.6) | 7 (17.1) | 0.36 |
| Ceftriaxone dose (g) | 4 (1–6) | 2 (1–5) | 5 (3–7) | 0.17 |
| Ertapenem | 5 (4.2) | 4 (5.1) | 1 (2.4) | 0.66 |
| Ertapenem dose (g) | 5 (2.5–7.0) | 4 (2.3–7.3) | 6 | 0.72 |
| Ciprofloxacin | 4 (3.4) | 2 (2.6) | 2 (4.9) | 0.61 |
| Ciprofloxacin dose (g) | 4.1 (1.4–6.3) | 1.9 (0.8–3) | 6.0 (5.2–6.7) | 0.25 |
| Sulfamethoxazole | 6 (5.0) | 5 (6.4) | 1 (2.4) | 0.66 |
| Sulfamethoxazole dose (g) | 2.0 (1.4–3.4) | 2.4 (1.6–3.6) | 0.8 | 0.23 |
| Trimethoprim | 6 (5.0) | 5 (6.4) | 1 (2.4) | 0.66 |
| Trimethoprim dose (g) | 0.4 (0.3–0.7) | 0.5 (0.3–0.7) | 0.2 | 0.23 |
| Caspofungin | 7 (5.9) | 4 (5.1) | 3 (7.3) | 0.69 |
| Caspofungin dose (g) | 0.2 (0.1–0.4) | 0.2 (0.12–0.4) | 0.3 (0.04–0.6) | 1.00 |
| Fluconazole | 18 (15.1) | 12 (15.4) | 6 (14.6) | 1.00 |
| Fluconazole dose (g) | 1.2 (0.7–2.6) | 1.2 (0.5–2.2) | 2.2 (0.7–4.1) | 0.4 |
| Ampicillin | 4 (3.4) | 3 (3.9) | 1 (2.4) | 1.00 |
| Ampicillin dose (g) | 42 (18.8–69.8) | 63 (18–72) | 21 | 1.00 |
| Doxycycline | 8 (6.7) | 5 (6.4) | 3 (7.3) | 1.00 |
| Doxycycline dose (g) | 0.8 (0.2–1.3) | 0.8 (0.2–1.6) | 0.7 (0.2–1.4) | 1.00 |
| Metronidazole | 12 (10.1) | 8 (10.3) | 4 (9.8) | 1.00 |
| Metronidazole dose (g) | 1.5 (1.0–2.9) | 1.3 (0.6–1.5) | 2.8 (1.4–10.5) | 0.14 |
| Levofloxacin | 5 (4.2) | 3 (3.9) | 2 (4.9) | 1.00 |
| Levofloxacin dose (g) | 0.8 (0.5–0.8) | 0.8 (0.5–0.8) | 0.6 (0.5–0.8) | 1.00 |
| Meropenem | 16 (13.5) | 10 (12.8) | 6 (14.6) | 0.78 |
| Meropenem dose (g) | 7.0 (3.0–27.3) | 5.3 (2.0–9.3) | 25.5 (11.3–47.5) | 0.05a |
| Tobramycin | 2 (1.7) | 1 (1.3) | 1 (2.4) | 1.00 |
| Tobramycin dose (g) | 2.8 (0.9–4.6) | 4.62 | 0.9 | 1.00 |
| Hydroxychloroquine | 8 (7.2) | 5 (6.4) | 3 (7.3) | 1.00 |
| Hydroxychloroquine dose (g) | 2 (0.8–2.4) | 2.2 (1.3–2.4) | 0.8 (0.6–2.4) | 0.44 |
| Remdesivir | 13 (10.9) | 7 (9.0) | 6 (14.6) | 0.37 |
| Remdesivir dose (g) | 0.6 (0.6–0.6) | 0.6 (0.6–0.6) | 0.6 (0.5–0.7) | 0.68 |
| Steroid | ||||
| Hydrocortisone | 46 (38.7) | 26 (33.3) | 20 (48.8) | 0.12 |
| Hydrocortisone dose (mg) | 400.0 (250–837.5) | 362.5 (250.0–656.3) | 500.0 (150.0–1,000) | 0.71 |
| Methylprednisolone | 9 (7.6) | 6 (7.7) | 3 (7.3) | 1.00 |
| Methylprednisolone dose (mg) | 125.0 (62.0–497.5) | 187.5 (91.0–657.5) | 60.0 (20.0–600.0) | 0.37 |
| Dexamethasone | 8 (6.7) | 5 (6.4) | 3 (7.3) | 1.00 |
| Dexamethasone dose (mg) | 16 (7–60) | 60 (5–168) | 14 (10–18) | 0.76 |
| Prednisone | 6 (5.0) | 4 (5.1) | 2 (4.9) | 1.00 |
| Prednisone dose (mg) | 35.0 (23.8–122.5) | 65.0 (28.8–187.5) | 25.0 (20.0–30.0) | 0.25 |
| Drug with anticholinergic properties | ||||
| Famotidine | 8 (6.7) | 5 (6.4) | 3 (7.3) | 1.00 |
| Famotidine dose (mg) | 100 (25–140) | 140 (50–200) | 20 (20–140) | 0.22 |
| Diphenhydramine | 16 (13.5) | 13 (16.7) | 3 (7.3) | 0.26 |
| Diphenhydramine dose (mg) | 75 (28.1–137.5) | 75 (25.0–125.0) | 100 (37.5–250.0) | 0.59 |
| Prochlorperazine | 7 (5.9) | 5 (6.4) | 2 (4.9) | 1.00 |
| Prochlorperazine dose (mg) | 10 (10.0–20.0) | 10 (7.5–30.0) | 10 | 0.83 |
| Promethazine | 2 (1.7) | 1 (1.3) | 1 (2.4) | 1.00 |
| Promethazine dose (mg) | 81.3 (12.5–150.0) | 12.5 | 150 | 1.00 |
| Variable | Total cohort | Delirium (n=41) | No delirium (n=78) | P-value |
|---|---|---|---|---|
| CCL2 | 761.86 (447.83–1,358.52) | 1,295.60 (709.43–2,092.03) | 636.05 (413.35–1,019.30) | <0.00a |
| CCL3 | 0 (0–3.57) | 1.36 (0–7.24) | 0 (0–2.72) | <0.01a |
| CXCL1 | 26.24 (10.82–47.33) | 29.64 (17.95–53.50) | 23.45 (8.79–34.56) | 0.01a |
| CXCL10 | 366.72 (149.05–2,834.38) | 1,159.90 (277.06–3,856.02) | 269.95 (132.38–1,928.12) | <0.01a |
| G-CSF | 183.38 (47.55–448.23) | 266.51 (54.74–1,746.52) | 172.27 (34.57–348.59) | 0.07 |
| GM-CSF | 0 (0–0) | 0 (0–2.55) | 0 (0–0) | 0.40 |
| IL-1α | 12.60 (3.19–27.66) | 14.17 (3.16–33.10) | 9.45 (3.75–24.10) | 0.46 |
| IL-1β | 6.89 (0–16.68) | 8.27 (2.72–18.45) | 5.10 (0–17.11) | 0.13 |
| IL-1RA | 12.81 (4.00–57.49) | 29.33 (7.91–135.39) | 8.54 (3.41–33.16) | <0.01a |
| IL-2 | 0 (0–0.14) | 0 (0–0.30) | 0 (0–0) | 0.29 |
| IL-4 | 2.84 (0.33–6.88) | 2.84 (0.65–6.57) | 2.93 (0–7.01) | 0.91 |
| IL-5 | 4.61 (0.90–11.61) | 3.10 (0.81–10.23) | 5.76 (0.90–12.90) | 0.15 |
| IL-6 | 194.64 (51.43–467.04) | 405.67 (154.87–720.89) | 130.46 (46.46–369.77) | <0.01a |
| IL-8 | 33.37 (20.49–59.42) | 42.62 (24.56–92.87) | 29.48 (19.17–48.24) | 0.02a |
| IL-10 | 24.66 (1.06–70.50) | 47.04 (9.83–95.50) | 18.70 (0–47.27) | 0.02a |
| IL-12 | 0 (0–0.27) | 0 (0–0.41) | 0 (0–0.17) | 1.00 |
| IL-17A | 0 (0–0.46) | 0 (0–0.93) | 0 (0–0) | 0.51 |
| IL-18 | 104.67 (38.66–161.50) | 136.05 (95.13–175.88) | 77.21 (27.69–134.16) | 0.02a |
| TNF-α | 28.31 (12.17–52.95) | 40.37 (16.94–66.59) | 25.34 (9.25–47.12) | 0.02a |
Values are presented as median interquartile range. (%).
CCL: C-C motif ligand; CXCL: C-X-C motif chemokine ligand; G-CSF: granulocyte colony-stimulating factor; GM-CSF: granulocyte-macrophage colony-stimulating factor; IL: interleukin; IL-1RA: IL 1 receptor antagonist; TNF: tumor necrosis factor.
a P≤0.05.
| Variable | Total delirium group | Sepsis (n=29) | No sepsis (n=12) | P-value |
|---|---|---|---|---|
| CCL2 | 1,295.6 (709.4–2,092.0) | 1,422.6 (835.5–2,496.7) | 739.1 (440.7–1,292.7) | 0.03a |
| CCL3 | 1.4 (0–7.2) | 1.4 (0–5.1) | 0.7 (0–36.1) | 0.94 |
| CXCL1 | 29.6 (18.0–53.5) | 34.1 (17.9–52.0) | 28.5 (18.4–80.5) | 0.98 |
| CXCL10 | 1,159.9 (277.1–3,856.0) | 2,638.6 (928.6–4,069.1) | 254.0 (98.9–506.9) | <0.001a |
| G-CSF | 266.5 (54.7–1746.5) | 183.4 (44.5–1909.2) | 359.5 (185.4–730.4) | 0.32 |
| GM-CSF | 0 (0–2.6) | 0 (0–0) | 2.6 (0–3.9) | 0.02a |
| IL-1α | 14.2 (3.2–33.1) | 13.4 (5.5–27.6) | 15.8 (0.8–60.6) | 0.94 |
| IL-1β | 8.3 (2.7–18.5) | 10.1 (6.7–18.4) | 2.7 (0–21.5) | 0.15 |
| IL-1RA | 29.3 (7.9–135.4) | 43.0 (14.4–144.2) | 8.8 (3.9–113.4) | 0.07 |
| IL-2 | 0 (0–0.3) | 0 (0–0.3) | 0 (0–0.7) | 0.87 |
| IL-4 | 2.8 (0.7–6.6) | 3.5 (0.6–6.8) | 2.1 (0.6–6.4) | 0.66 |
| IL-5 | 3.1 (0.8–10.2) | 2.3 (0.8–9.0) | 4.6 (0.7–16.0) | 0.49 |
| IL-6 | 405.7 (154.9–720.9) | 405.7 (154.9–843.8) | 359.3 (48.2–598.7) | 0.34 |
| IL-8 | 42.6 (24.6–92.9) | 42.6 (26.6–86.1) | 55.7 (19.2–102.3) | 0.87 |
| IL-10 | 47.0 (9.8–95.5) | 50.1 (14.3–95.5) | 44.0 (7.3–89.4) | 0.92 |
| IL-12 | 0 (0–0.4) | 0 (0–0.7) | 0 (0–0.2) | 1.0 |
| IL-17A | 0 (0–0.9) | 0 (0–0.9) | 0 (0–1.4) | 0.86 |
| IL-18 | 136.1 (95.1–175.9) | 140.0 (102.4–177.7) | 53.4 (19.7–160.1) | 0.12 |
| TNF-α | 40.4 (16.9–66.6) | 49.8 (25.3–42.4) | 18.5 (9.8–42.4) | <0.01a |
Values are presented as median (interquartile range).
CCL: C-C motif ligand; CXCL: C-X-C motif chemokine ligand; G-CSF: granulocyte colony-stimulating factor; GM-CSF: granulocyte-macrophage colony-stimulating factor; IL: interleukin; IL-1RA: IL 1 receptor antagonist; TNF: tumor necrosis factor.
a P≤0.05.
| Variable | Total delirium group | COVID-19 (n=20) | No COVID-19 (n=21) | P-value |
|---|---|---|---|---|
| CCL2 | 1,295.6 (709.4–2,092.0) | 1,471.6 (900.1–2,451.1) | 761.9 (328.5–1,395.3) | 0.02a |
| CCL3 | 1.4 (0–7.2) | 0.9 (0.1–2.9) | 4.1 (0–28.2) | 0.37 |
| CXCL1 | 29.6 (18.0–53.5) | 39.2 (18.6–52.6) | 28.5 (14.5–71.6) | 0.69 |
| CXCL10 | 1,159.9 (277.1–3,856.0) | 3,694.3 (1,625.4–4074.3) | 329.0 (120–903.6) | <0.001a |
| G-CSF | 266.5 (54.7–1,746.5) | 81.6 (42.1–1,322.4) | 438.9 (170.6–2,253.1) | 0.05a |
| GM-CSF | 0 (0–2.6) | 0 (0–0) | 1.2 (0–3.9) | <0.01a |
| IL-1α | 14.2 (3.2–33.1) | 12.6 (5.1–20.5) | 19.8 (3.1–54.2) | 0.31 |
| IL-1β | 8.3 (2.7–18.5) | 8.3 (5.1–14.5) | 7.3 (2.7–23.0) | 0.91 |
| IL-1RA | 29.3 (7.9–135.4) | 40.7 (17.1–89.1) | 10.8 (5.2–278.3) | 0.38 |
| IL-2 | 0 (0–0.3) | 0 (0–0.2) | 0 (0–0.8) | 0.16 |
| IL-4 | 2.8 (0.7–6.6) | 4.6 (1–6.9) | 1.6 (0.2–6.2) | 0.29 |
| IL-5 | 3.1 (0.8–10.2) | 4.7 (0.9–10.5) | 1.7 (0.5–7.9) | 0.4 |
| IL-6 | 405.7 (154.9–720.9) | 461.9 (182.4–893.9) | 397.5 (37.8–618.9) | 0.22 |
| IL-8 | 42.6 (24.6–92.9) | 42.2 (26.8–58.3) | 78.9 (20.7–129.9) | 0.4 |
| IL-10 | 47.0 (9.8–95.5) | 36.7 (13.4–77.7) | 59.7 (7.3–165.8) | 0.27 |
| IL-12 | 0 (0–0.4) | 0 (0–0) | 0 (0–3.4) | 0.09 |
| IL-17A | 0 (0–0.9) | 0 (0–0.9) | 0 (0–1.4) | 0.54 |
| IL-18 | 136.1 (95.1–175.9) | 140.1 (104.8–176.7) | 53.4 (27.9–187.6) | 0.21 |
| TNF-α | 40.4 (16.9–66.6) | 48 (30.1–72.3) | 21.2 (11.2–63.3) | 0.05a |
Values are presented as median (interquartile range).
COVID-19: coronavirus disease 2019; CCL: C-C motif ligand; CXCL: C-X-C motif chemokine ligand; G-CSF: granulocyte colony-stimulating factor; GM-CSF: granulocyte-macrophage CSF; IL: interleukin; IL-1RA: IL 1 receptor antagonist; TNF: tumor necrosis factor.
a P≤0.05.
| Variable | Total delirium group | Surgery (n=11) | No surgery (n=30) | P-value |
|---|---|---|---|---|
| CCL2 | 1,295.6 (709.4–2,092.0) | 915.1 (561.2–1,385.4) | 1,392.0 (753.3–2,193.1) | 0.44 |
| CCL3 | 1.4 (0–7.2) | 4.1 (0–42.8) | 0.9 (0–4.6) | 0.29 |
| CXCL1 | 29.6 (18.0–53.5) | 26.8 (16.0–53.9) | 33.0 (19.0–57.3) | 0.58 |
| CXCL10 | 1,159.9 (277.1–3,856.0) | 271.0 (92.7–1,025.7) | 2,315.9 (335.5–4,034.5) | 0.01a |
| G-CSF | 266.5 (54.7–1,746.5) | 518.0 (275.7–2,628.4) | 149.0 (46.9–1131.7) | 0.05a |
| GM-CSF | 0 (0–2.6) | 0 (0–2.6) | 0 (0–0.6) | 0.39 |
| IL-1α | 14.2 (3.2–33.1) | 14.9 (3.1–66.9) | 13.8 (4.3–29.3) | 0.98 |
| IL-1β | 8.3 (2.7–18. 5) | 5.5 (2.7–15.7) | 8.3 (6.0–20.8) | 0.59 |
| IL-1RA | 29.3 (7.9–135.4) | 25.9 (7.8–142.6) | 38.7 (8.8–136.2) | 0.65 |
| IL-2 | 0 (0–0.3) | 0 (0–0.9) | 0 (0–0.3) | 0.92 |
| IL-4 | 2.8 (0.7–6.6) | 1.9 (0.4–5.7) | 3.8 (0.8–6.7) | 0.63 |
| IL-5 | 3.1 (0.8–10.2) | 3.5 (0.6–12.2) | 2.7 (0.9–10.2) | 0.98 |
| IL-6 | 405.7 (154.9–720.9) | 426.6 (165.6–634.1) | 381.7 (130.5–738.2) | 0.94 |
| IL-8 | 42.6 (24.6–92.9) | 82.9 (23.7–109.9) | 41.2 (24.1–73.7) | 0.47 |
| IL-10 | 47.0 (9.8–95.5) | 59.7 (40.3–97.3) | 36.5 (5.4–95.4) | 0.30 |
| IL-12 | 0 (0–0.4) | 0 (0–0.3) | 0 (0–0.6) | 0.90 |
| IL-17A | 0 (0–0.9) | 0 (0–0) | 0 (0–1.2) | 0.71 |
| IL-18 | 136.1 (95.1–175.9) | 106.8 (28.1–173.2) | 136.0 (100.1–176.4) | 0.39 |
| TNF-α | 40.4 (16.9–66.6) | 21.2 (16.3–60.0) | 43.9 (20.4–73.7) | 0.21 |
- 1. Oldham MA, Flaherty JH, Maldonado JR. Refining delirium: a transtheoretical model of delirium disorder with preliminary neurophysiologic subtypes. Am J Geriatr Psychiatry 2018;26:913-24.ArticlePubMed
- 2. Wilson JE, Mart MF, Cunningham C, Shehabi Y, Girard TD, MacLullich AM, et al. Delirium. Nat Rev Dis Primers 2020;6:90. ArticlePubMedPMC
- 3. Maldonado JR. Acute brain failure: pathophysiology, diagnosis, management, and sequelae of delirium. Crit Care Clin 2017;33:461-519.PubMed
- 4. Mattison ML. Delirium. Ann Intern Med 2020;173:ITC49-64. Article
- 5. Reade MC, Finfer S. Sedation and delirium in the intensive care unit. N Engl J Med 2014;370:444-54.ArticlePubMed
- 6. Oh ES, Fong TG, Hshieh TT, Inouye SK. Delirium in older persons: advances in diagnosis and treatment. JAMA 2017;318:1161-74.ArticlePubMedPMC
- 7. Kealy J, Murray C, Griffin EW, Lopez-Rodriguez AB, Healy D, Tortorelli LS, et al. Acute inflammation alters brain energy metabolism in mice and humans: role in suppressed spontaneous activity, impaired cognition, and delirium. J Neurosci 2020;40:5681-96.ArticlePubMedPMC
- 8. Maldonado JR. Delirium pathophysiology: an updated hypothesis of the etiology of acute brain failure. Int J Geriatr Psychiatry 2018;33:1428-57.ArticlePubMed
- 9. de Rooij SE, van Munster BC, Korevaar JC, Levi M. Cytokines and acute phase response in delirium. J Psychosom Res 2007;62:521-5.ArticlePubMed
- 10. Skrede K, Wyller TB, Watne LO, Seljeflot I, Juliebø V. Is there a role for monocyte chemoattractant protein-1 in delirium?: novel observations in elderly hip fracture patients. BMC Res Notes 2015;8:186. ArticlePubMedPMC
- 11. Jin Z, Hu J, Ma D. Postoperative delirium: perioperative assessment, risk reduction, and management. Br J Anaesth 2020;125:492-504.ArticlePubMed
- 12. Marcantonio ER. Delirium in hospitalized older adults. N Engl J Med 2017;377:1456-66.ArticlePubMedPMC
- 13. Yang T, Velagapudi R, Terrando N. Neuroinflammation after surgery: from mechanisms to therapeutic targets. Nat Immunol 2020;21:1319-26.ArticlePubMedPMC
- 14. Honarmand K, Lalli RS, Priestap F, Chen JL, McIntyre CW, Owen AM, et al. Natural history of cognitive impairment in critical illness survivors: a systematic review. Am J Respir Crit Care Med 2020;202:193-201.ArticlePubMedPMC
- 15. Wu YC, Tseng PT, Tu YK, Hsu CY, Liang CS, Yeh TC, et al. Association of delirium response and safety of pharmacological interventions for the management and prevention of delirium: a network meta-analysis. JAMA Psychiatry 2019;76:526-35.ArticlePubMedPMC
- 16. Lauretani F, Bellelli G, Pelà G, Morganti S, Tagliaferri S, Maggio M. Treatment of delirium in older persons: what we should not do! Int J Mol Sci 2020;21:2397. ArticlePubMedPMC
- 17. Munster BC, Aronica E, Zwinderman AH, Eikelenboom P, Cunningham C, Rooij SE. Neuroinflammation in delirium: a postmortem case-control study. Rejuvenation Res 2011;14:615-22.ArticlePubMedPMC
- 18. Burkhart CS, Dell-Kuster S, Siegemund M, Pargger H, Marsch S, Strebel SP, et al. Effect of n-3 fatty acids on markers of brain injury and incidence of sepsis-associated delirium in septic patients. Acta Anaesthesiol Scand 2014;58:689-700.ArticlePubMed
- 19. van den Boogaard M, Kox M, Quinn KL, van Achterberg T, van der Hoeven JG, Schoonhoven L, et al. Biomarkers associated with delirium in critically ill patients and their relation with long-term subjective cognitive dysfunction; indications for different pathways governing delirium in inflamed and noninflamed patients. Crit Care 2011;15:R297. ArticlePubMedPMC
- 20. Cape E, Hall RJ, van Munster BC, de Vries A, Howie SE, Pearson A, et al. Cerebrospinal fluid markers of neuroinflammation in delirium: a role for interleukin-1β in delirium after hip fracture. J Psychosom Res 2014;77:219-25.ArticlePubMedPMC
- 21. Subramaniyan S, Terrando N. Neuroinflammation and perioperative neurocognitive disorders. Anesth Analg 2019;128:781-8.ArticlePubMedPMC
- 22. Andonegui G, Zelinski EL, Schubert CL, Knight D, Craig LA, Winston BW, et al. Targeting inflammatory monocytes in sepsis-associated encephalopathy and long-term cognitive impairment. JCI Insight 2018;3:e99364.ArticlePubMedPMC
- 23. Beloosesky Y, Hendel D, Weiss A, Hershkovitz A, Grinblat J, Pirotsky A, et al. Cytokines and C-reactive protein production in hip-fracture-operated elderly patients. J Gerontol A Biol Sci Med Sci 2007;62:420-6.ArticlePubMed
- 24. Atterton B, Paulino MC, Povoa P, Martin-Loeches I. Sepsis associated delirium. Medicina (Kaunas) 2020;56:240. ArticlePubMedPMC
- 25. Vasunilashorn SM, Ngo L, Inouye SK, Libermann TA, Jones RN, Alsop DC, et al. Cytokines and postoperative delirium in older patients undergoing major elective surgery. J Gerontol A Biol Sci Med Sci 2015;70:1289-95.ArticlePubMedPMC
- 26. Pandharipande PP, Girard TD, Jackson JC, Morandi A, Thompson JL, Pun BT, et al. Long-term cognitive impairment after critical illness. N Engl J Med 2013;369:1306-16.ArticlePubMedPMC
- 27. Cerejeira J, Firmino H, Vaz-Serra A, Mukaetova-Ladinska EB. The neuroinflammatory hypothesis of delirium. Acta Neuropathol 2010;119:737-54.ArticlePubMed
- 28. Guo Y, Li Y, Zhang Y, Fang S, Xu X, Zhao A, et al. Post-operative delirium associated with metabolic alterations following hemi-arthroplasty in older patients. Age Ageing 2019;49:88-95.ArticlePubMed
- 29. Maclullich AM, Ferguson KJ, Miller T, de Rooij SE, Cunningham C. Unravelling the pathophysiology of delirium: a focus on the role of aberrant stress responses. J Psychosom Res 2008;65:229-38.ArticlePubMedPMC
- 30. Maldonado JR. Neuropathogenesis of delirium: review of current etiologic theories and common pathways. Am J Geriatr Psychiatry 2013;21:1190-222.ArticlePubMed
- 31. Serhan CN, Levy BD. Resolvins in inflammation: emergence of the pro-resolving superfamily of mediators. J Clin Invest 2018;128:2657-69.ArticlePubMedPMC
- 32. Dabrowski W, Siwicka-Gieroba D, Gasinska-Blotniak M, Zaid S, Jezierska M, Pakulski C, et al. Pathomechanisms of non-traumatic acute brain injury in critically ill patients. Medicina (Kaunas) 2020;56:469. ArticlePubMedPMC
- 33. Watt CL, Momoli F, Ansari MT, Sikora L, Bush SH, Hosie A, et al. The incidence and prevalence of delirium across palliative care settings: a systematic review. Palliat Med 2019;33:865-77.ArticlePubMedPMC
- 34. Mukaetova-Ladinska EB, Kronenberg G, Raha-Chowdhury R. COVID-19 and neurocognitive disorders. Curr Opin Psychiatry 2021;34:149-56.ArticlePubMed
- 35. Hawkins M, Sockalingam S, Bonato S, Rajaratnam T, Ravindran M, Gosse P, et al. A rapid review of the pathoetiology, presentation, and management of delirium in adults with COVID-19. J Psychosom Res 2021;141:110350. ArticlePubMed
- 36. Najjar S, Najjar A, Chong DJ, Pramanik BK, Kirsch C, Kuzniecky RI, et al. Central nervous system complications associated with SARS-CoV-2 infection: integrative concepts of pathophysiology and case reports. J Neuroinflammation 2020;17:231. ArticlePubMedPMC
- 37. Singer M, Deutschman CS, Seymour CW, Shankar-Hari M, Annane D, Bauer M, et al. The third international consensus definitions for sepsis and septic shock (Sepsis-3). JAMA 2016;315:801-10.ArticlePubMedPMC
- 38. Ely EW, Inouye SK, Bernard GR, Gordon S, Francis J, May L, et al. Delirium in mechanically ventilated patients: validity and reliability of the confusion assessment method for the intensive care unit (CAM-ICU). JAMA 2001;286:2703-10.ArticlePubMed
- 39. Intensive Care Network. Apache IV score [Internet]. Intensive Care Network. 2021;[cited 2021 Apr 22]. Available from: https://intensivecarenetwork.com/Calculators/Files/Apache4.html.
- 40. Vincent JL, Moreno R, Takala J, Willatts S, De Mendonça A, Bruining H, et al. The SOFA (Sepsis-related Organ Failure Assessment) score to describe organ dysfunction/failure: on behalf of the Working Group on Sepsis-Related Problems of the European Society of Intensive Care Medicine. Intensive Care Med 1996;22:707-10.ArticlePubMed
- 41. de Oliveira C, Khatua B, Noel P, Kostenko S, Bag A, Balakrishnan B, et al. Pancreatic triglyceride lipase mediates lipotoxic systemic inflammation. J Clin Invest 2020;130:1931-47.ArticlePubMedPMC
- 42. Navina S, Acharya C, DeLany JP, Orlichenko LS, Baty CJ, Shiva SS, et al. Lipotoxicity causes multisystem organ failure and exacerbates acute pancreatitis in obesity. Sci Transl Med 2011;3:107ra110. ArticlePubMedPMC
- 43. Moraes CA, Zaverucha-do-Valle C, Fleurance R, Sharshar T, Bozza FA, d’Avila JC. Neuroinflammation in sepsis: molecular pathways of microglia activation. Pharmaceuticals (Basel) 2021;14:416. ArticlePubMedPMC
- 44. Galea I, Perry VH. The blood-brain interface: a culture change. Brain Behav Immun 2018;68:11-6.ArticlePubMed
- 45. Alexander JJ, Jacob A, Cunningham P, Hensley L, Quigg RJ. TNF is a key mediator of septic encephalopathy acting through its receptor, TNF receptor-1. Neurochem Int 2008;52:447-56.ArticlePubMed
- 46. Smyth LC, Rustenhoven J, Park TI, Schweder P, Jansson D, Heppner PA, et al. Unique and shared inflammatory profiles of human brain endothelia and pericytes. J Neuroinflammation 2018;15:138. ArticlePubMedPMC
- 47. Banks WA, Dohi K, Hansen K, Thompson HJ. Assessing blood granulocyte colony-stimulating factor as a potential biomarker of acute traumatic brain injury in mice and humans. Brain Behav Immun 2016;52:81-7.ArticlePubMed
- 48. Li L, McBride DW, Doycheva D, Dixon BJ, Krafft PR, Zhang JH, et al. G-CSF attenuates neuroinflammation and stabilizes the blood-brain barrier via the PI3K/Akt/GSK-3β signaling pathway following neonatal hypoxia-ischemia in rats. Exp Neurol 2015;272:135-44.ArticlePubMedPMC
- 49. Chui R, Dorovini-Zis K. Regulation of CCL2 and CCL3 expression in human brain endothelial cells by cytokines and lipopolysaccharide. J Neuroinflammation 2010;7:1. ArticlePubMedPMC
- 50. Liu KK, Dorovini-Zis K. Differential regulation of CD4+ T cell adhesion to cerebral microvascular endothelium by the β-chemokines CCL2 and CCL3. Int J Mol Sci 2012;13:16119-40.ArticlePubMedPMC
- 51. De Laere M, Sousa C, Meena M, Buckinx R, Timmermans JP, Berneman Z, et al. Increased transendothelial transport of CCL3 is insufficient to drive immune cell transmigration through the blood-brain barrier under inflammatory conditions in vitro. Mediators Inflamm 2017;2017:6752756. ArticlePubMedPMC
- 52. Shehabi Y, Howe BD, Bellomo R, Arabi YM, Bailey M, Bass FE, et al. Early sedation with dexmedetomidine in critically ill patients. N Engl J Med 2019;380:2506-17.ArticlePubMed
References
Figure & Data
References
Citations
- Association of postoperative delirium with serum and cerebrospinal fluid proteomic profiles: a prospective cohort study in older hip fracture patients
Lucía Lozano-Vicario, Ángel Javier Muñoz-Vázquez, Robinson Ramírez-Vélez, Arkaitz Galbete-Jiménez, Joaquín Fernández-Irigoyen, Enrique Santamaría, Bernardo Abel Cedeno-Veloz, Fabricio Zambom-Ferraresi, Barbara C. Van Munster, José Ramón Ortiz-Gómez, Ángel
GeroScience.2024;[Epub] CrossRef - Association of peripheral B cells and delirium: combined single-cell sequencing and Mendelian randomization analysis
Siyou Tan, Sining Pan, Lai Wei, Wenyan Chen, Bingbing Pan, Gaoyin Kong, Jing Chen, Yubo Xie
Frontiers in Neurology.2024;[Epub] CrossRef - Brain injury biomarkers do not predict delirium in acutely ill older patients: a prospective cohort study
Júlio César Garcia de Alencar, Flávia Barreto Garcez, Agnes Araujo Sardinha Pinto, Lucas Oliveira Junqueira e Silva, Lucas de Moraes Soler, Shirley Steffany Muñoz Fernandez, Victor Van Vaisberg, Luz Marina Gomez Gomez, Sandra Maria Lima Ribeiro, Thiago Ju
Scientific Reports.2023;[Epub] CrossRef - Systemic interleukin-6 inhibition ameliorates acute neuropsychiatric phenotypes in a murine model of acute lung injury
Faizan Anwar, Nicklaus A. Sparrow, Mohammad Harun Rashid, Gena Guidry, Michael M. Gezalian, Eric J. Ley, Maya Koronyo-Hamaoui, Itai Danovitch, E. Wesley Ely, S. Ananth Karumanchi, Shouri Lahiri
Critical Care.2022;[Epub] CrossRef
 PubReader
 ePub Link
 Cite
Cite

