Changes in the Characteristics and Long-term Mortality Rates of Intensive Care Unit Patients from 2003 to 2010: A Nationwide Population-Based Cohort Study Performed in the Republic of Korea
Article information

Abstract
Background
There are few studies on intensive care unit (ICU) patients in the Republic of Korea. We analyzed the characteristics and mortality changes of all ICU patients over the last 8 years.
Methods
This study used the cohort of the National Health Insurance Corporation, which provides medical care to all residents of the Republic of Korea. The cohort consists of patients aged 20 years or older between 2003 and 2010 with a history of ICU admission. We analyzed changes in sex, age, household income, number of hospital beds, emergency admissions, and reasons for admission using the Cochran–Armitage trend test. The adjusted hazard ratios (HRs) of mortality according to these variables and year of admission were calculated by Cox proportional hazards regression.
Results
The proportion of patients aged ≥70 years increased over that period, as did their average age (by 3.6 years). During the 8-year study period, the 3-year mortality rate was 32.91%–35.83%. The overall mortality was higher in males and older patients, in those with a lower household income and higher Charlson Comorbidity Index (CCI) score, those admitted to a hospital with a smaller number of beds, and those admitted via the emergency room. There was no significant change in crude mortality rate over the 8-year study period; however, the adjusted HR showed a decreasing trend.
Conclusions
Patients admitted to the ICU were older and had higher CCI score. Nevertheless, there was a temporal trend toward a decrease in the HR of long-term mortality.
INTRODUCTION
Over the past several decades, developments in medicine and increasing age of the population have led to many changes in the characteristics and mortality rates of patients admitted to the intensive care unit (ICU) [1]. The Korean population is aging rapidly, and the average life expectancy of Korean women born in 2030 is predicted to exceed 90 years [2]. These changes are likely to bring about further rapid aging and changes in the characteristics of patients admitted in ICUs in the Republic of Korea. In ICUs, treatment is highly intensive; consequently, the costs and mortality rates are also high [3,4]. The rates of ICU use are increasing; thus, the costs are also growing [5-7]. Therefore, there has been continuous interest in the consequences of changes in characteristics and mortality rates of ICU patients.
It is difficult to evaluate nationwide changes in ICU admissions due to variations in factors such as hospital volume and location and number of beds. A National Health Insurance Cohort sample has been established in the Republic of Korea comprising approximately 1 million people (2.2% of the total population), which can be considered representative of the general population [8]. Data from large cohorts on the characteristics and mortality rates of ICU admissions are available and is important for predicting changes in such characteristics [9,10].
This study used a nationwide cohort study, the National Health Insurance Service-National Sample Cohort (NHIS-NSC), to analyze the changes in characteristics of ICU patients and changes in mortality rate according to the factors of interest over the past 8 years. These data will be important to prepare for future trends in critical care needs in the ICU.
MATERIALS AND METHODS
Cohort and Patients
Korea has a single-payer national health system. The Korean National Health Insurance covers approximately 97% of the population in the Republic of Korea. We used the South Korean NHIS-NSC, which is a population-based cohort. A representative sample of about 1 million people, comprising 2.2% of the entire Korean population of 2002, was selected using systematic stratified random sampling, with proportional allocation to each stratum. All patients were followed up to 2013, unless they died or left the country. Loss of subjects due to death or emigration was compensated for by adding newborn data annually. Thus, the size of the cohort was maintained at 1 million up to 2013. The data include eligibility and demographic information, as well as medical treatments, prescriptions, and general health examination results [8].
Patients and Study Design
From the NHIS-NSC database containing data on 1,097,321 subscribers for the period of 2002–2010, the study population consisted of all patients >20 years old admitted to an ICU of a hospital with more than 300 beds and who were covered by the Korean National Health System between January 1, 2003 and December 31, 2010. In order to calculate 3-year mortality, subscribers of the NHIS-NSC between 2011 and 2013 were excluded. For calculation of the Charlson Comorbidity Index (CCI), patients admitted to the ICU in 2002 were excluded (n=1,888). The final number of ICU patients of interest during the study period was 25,400 (Figure 1). Factors of interest were sex, age, household income, CCI, hospital size, and reasons for admission, which have been studied in other ICU studies [11-14]. Household income in the NHIS-NCS was classified into deciles; in a further analysis, household income was divided into tertiles (low, deciles 0–4; middle, deciles 5–8; high, deciles 9–10). CCI was calculated according to main diagnosis and sub-diagnosis code during 1 year before the first day of ICU fee request according to the Korean Standard Classification of Diseases (KCD) codes of 17 diseases (Supplementary Table 1) [15]. Hospitals with ICUs were categorized into size tertiles (i.e., according to number of beds: 300–499, 500–803, >803). Reasons for admission were classified into eight categories according to KCD-6 (Supplementary Table 2), a modified version of the International Classification of Diseases, 10th revision. The study was reviewed by the Institutional Review Board of Kangwon National University Hospital (IRB No. KNUH-2018-01-001).
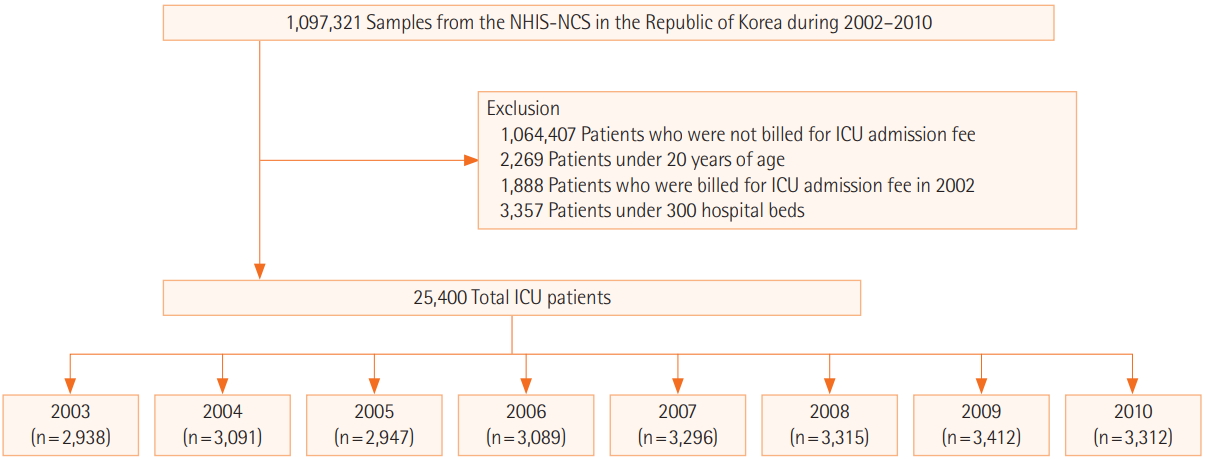
Flow chart of the study selection process. NHIS-NSC: National Health Insurance Service-National Sample Cohort; ICU: intensive care unit.
Statistical Analysis
The basic characteristics of the patients in this study were summarized as percentages and proportions, and the linear trends of the proportions of each category were tested by simple linear regressions. The crude mortality rate was calculated as the percentage of deaths of ICU patients admitted in each year for different follow-up periods since the first ICU admission, and the linear trends were examined using the Cochran-Armitage trend test. The chi-square test was performed for 90-day, 1-year, and 3-year mortality rates for each factor to compare differences in mortality according to factors. Cox proportional hazard regression was used to calculate adjusted hazard ratios (HRs) according to admission year to the ICU to determine whether the mortality of ICU patients showed an increasing or decreasing trend over years after adjusting for risk factors of interest. Patients who were alive or had dropped out by the end of the 3-year follow-up period were right-censored. Forest plots were constructed using adjusted HRs and their 95% confidence intervals in Cox models and stratified Cox models by admission reason. Statistical analyses were performed using SAS software version 9.4 (SAS Institute, Cary, NC, USA).
RESULTS
Temporal Trends in Patient Characteristics
During the 8-year period from 2003 to 2010, the number of applicable ICU admissions in Korea was 25,400. The proportion of males was higher than females in every year, by 9% to 20%. The proportion of patients aged ≥70 years increased over the study period, as did the average age (by 3.6 years). According to household income data, the proportion of patients from middle class households admitted to the ICU decreased over the study period. The proportion of patients with CCI ≥2 increased, as did the proportion of patients admitted to the ICU via the emergency room. The proportion of patients admitted with trauma and poisoning increased over the study period, while the proportions of those admitted with gastrointestinal and liver diseases and with endocrinological diseases including diabetes decreased. However, there were no changes in the proportions of ICU admissions due to infectious diseases, cardiovascular diseases, respiratory diseases, or cancer over the study period (Table 1, Supplementary Table 3).
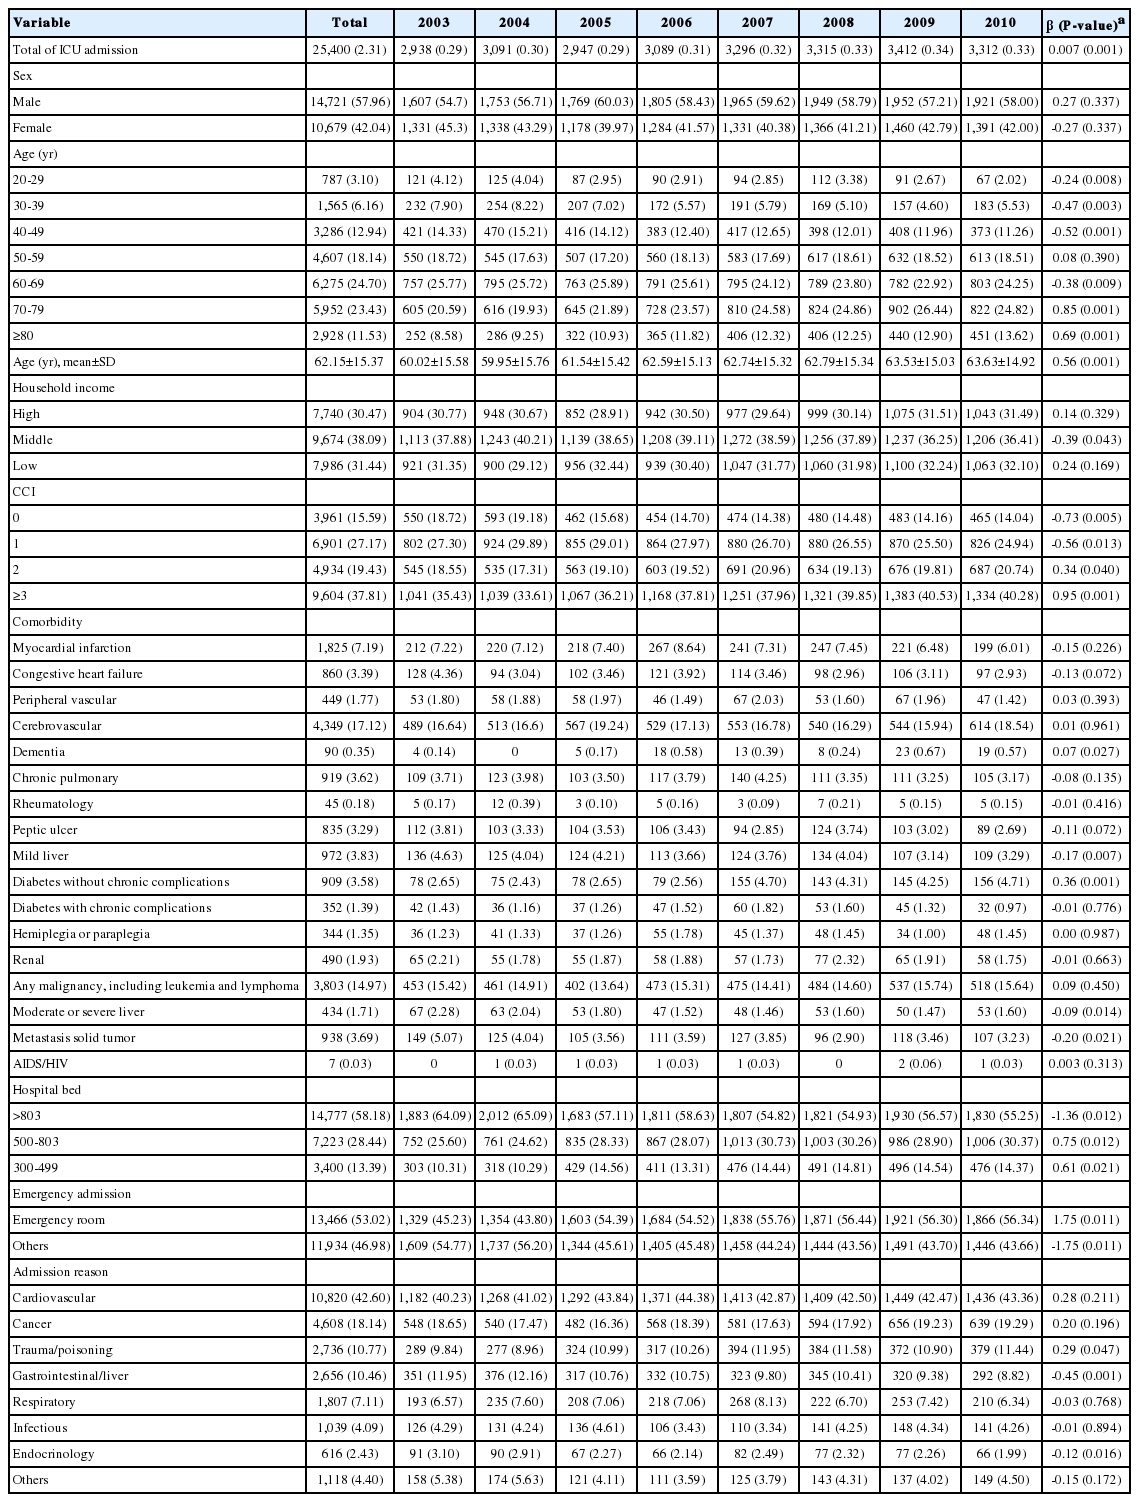
Basic characteristics of patients admitted to the ICU from 2003 to 2010
Hazard Ratio of Mortality
During the 8-year study period, the 90-day mortality rate was 16.71%–18.93%, the 1-year mortality rate was 24.48%–26.54%, and the 3-year mortality rate was 32.91%–35.83% (Table 2). The 3-year mortality rate was higher in males, older subjects, those with a lower household income and higher CCI score, those admitted to a hospital with a smaller number of beds, and those admitted via the emergency room. Regarding the reasons for admission, mortality rate were higher in cases of infectious disease, cancer, and respiratory disease (Table 3). There was no significant difference among 90-day, 1-year mortality, and 3-year mortality. Significant risk factors for mortality within 3 years after ICU admission were male sex (adjusted HR, 1.24; 95% CI, 1.19 to 1.30), age ≥80 years (adjusted HR, 7.35; 95% CI, 5.84 to 9.25), lower household income (adjusted HR, 1.20; 95% CI, 1.14 to 1.27), CCI ≥3 (adjusted HR, 2.16; 95% CI, 1.98 to 2.36), admitted to a hospital with a small number of beds (adjusted HR, 1.25; 95% CI, 1.18 to 1.33), admission via the emergency room (adjusted HR, 1.56; 95% CI, 1.49 to 1.63), respiratory disease (adjusted HR, 2.56; 95% CI, 2.17 to 3.01), cancer (adjusted HR, 2.68; 95% CI, 2.29 to 3.13), and infectious disease (adjusted HR, 2.96; 95% CI, 2.49 to 3.52) (Table 4, Figure 2). These findings showed no difference in 90-day and 1-year mortality analyses except that adjusted HRs were higher for sex, age, and CCI as the duration after ICU admission increased.

Annual mortality rate in the follow-up period at each admission year
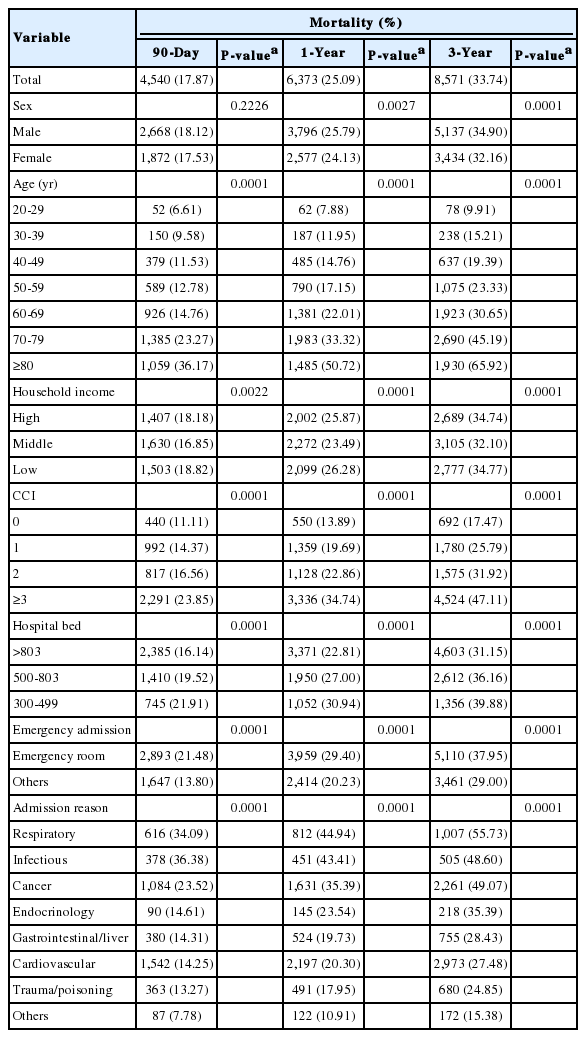
The crude mortality rates in the follow-up period according to each variable
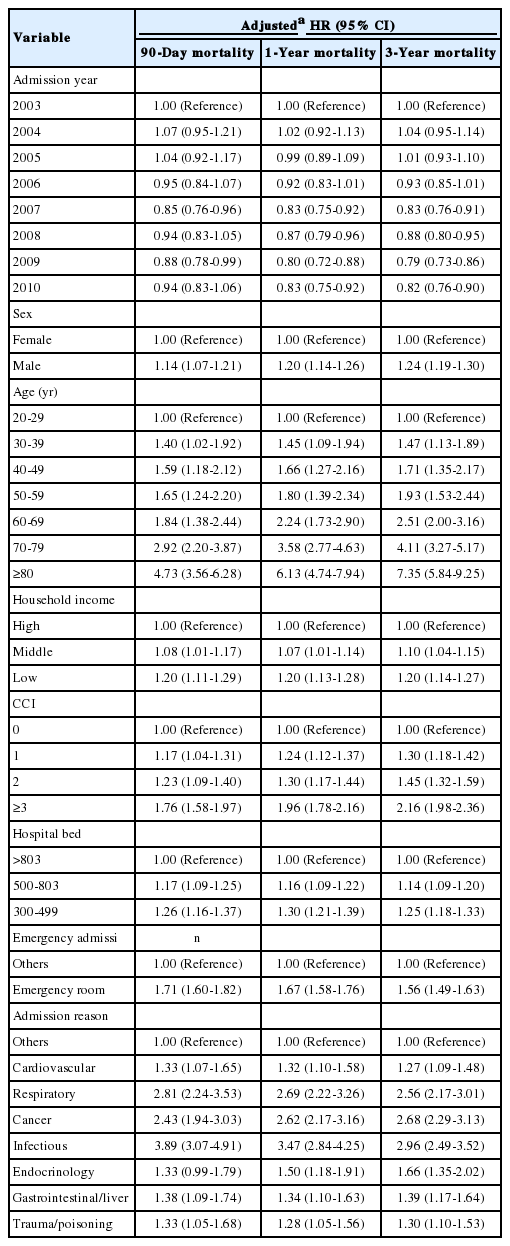
The adjusted hazard ratios of mortality by Cox proportional hazards regression
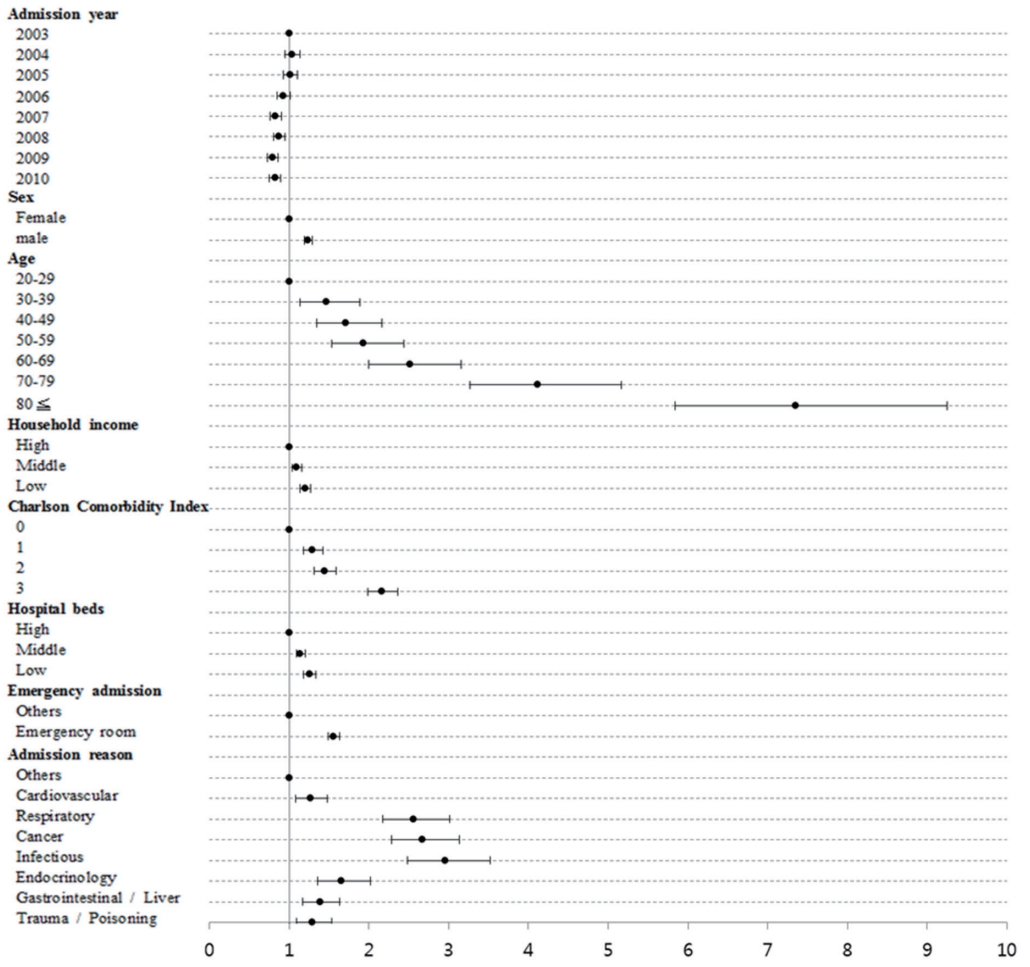
Forest plot of adjusted hazard ratio and 95% confidence interval in Cox models adjusted for sex, age, household income, Charlson Comorbidity Index, number of hospital beds, admission via the emergency room, and admission reason.
Temporal Trend of Mortality
During the 8-year study period, the 3-year mortality rate was 32.91%–35.83%, and there was no significant temporal trend (Table 2); however, adjusted HRs showed a decrease. Compared with 2003, the HR has continued to decline significantly since 2007, achieving a value of 0.82 (95% CI, 0.76 to 0.90) in 2010 (Table 4). In an analysis stratified according to reason for ICU admission, only cardiovascular disease showed a decreasing trend from 2003 onward, with the lowest HR being 0.66 (95% CI, 0.57 to 0.77) in 2010. There was no decrease in HR for any other disease, including cancer and respiratory disease (Figure 3).
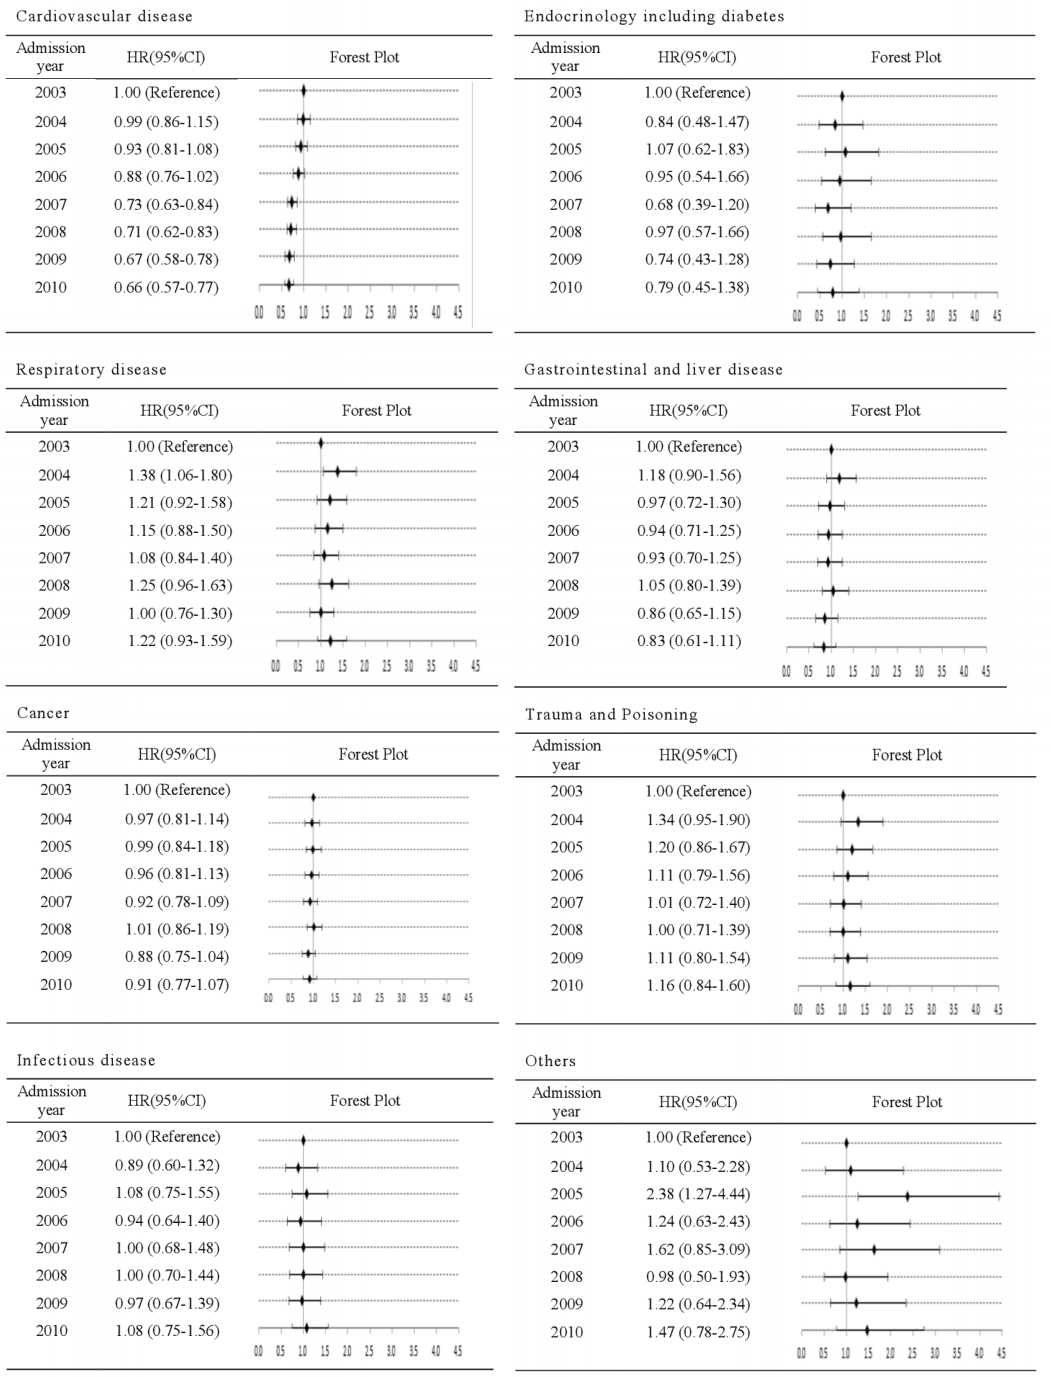
The adjusted hazard ratios (HRs) and 95% confidence intervals (CIs) of mortality and forest plots of HRs adjusted for sex, age, household income, Charlson comorbidity index, number of hospital beds, and admission via the emergency room in stratified Cox models by admission reason.
DISCUSSION
By reference to the data of a nationwide population-based cohort study, we examined changes in the characteristics and long-term survival rates of patients admitted to an ICU between 2003 and 2010. Patient age, CCI, rate of admission via the emergency room, and rate of admission to hospitals with a small number of beds all increased over the study period. There was a decreasing temporal trend in the HR of long-term mortality because of a reduction in mortality associated with cardiovascular disease.
An increase in average age of patients admitted to an ICU has been reported in several studies performed in developed countries [16]. In our study, the proportion of patients ≥70 years old increased over the study period, and the average age increased (by 3.6 years). In the future in the Republic of Korea, which is expected to have the most aged society in the world by 2030, patients admitted to the ICU are more likely to be of advanced age, and the proportion of patients ≥80 years old is likely to increase [2]. Therefore, it is necessary to prepare for the aging of patients admitted to the ICU. In particular, patients ≥80 years old showed a prominent increase in mortality rate in this study. This is an important result confirmed by the national cohort data. We should consider once more whether ICU admission is helpful for long-term survival in old age. Discussion about advance directives and patient’s decisions on life-sustaining treatment are increasingly necessary.
Differences in the proportions of ICU admissions by household income level were not marked. But, the adjusted risk of mortality was 1.2-fold higher in the lowest tertile versus the highest tertile. These findings agree with those of previous studies [13,17,18]. The adjusted HR of mortality at 90 days, 1-year, and 3-years was 1.2 (Table 4). It is important that both short-term and long-term care is affected by household income level with regard to mortality rate. This result implies that the physician needs to consider household income in treating critical illness and may consider a policy to reduce this difference.
The CCI has increased in patients admitted to the ICU. The HR of long-term mortality was also higher with a higher CCI. A number of physiological illness severity scoring systems have been developed in observational studies of ICU outcomes, such as the Simplified Acute Physiology Score (SAPS) [19], the Acute Physiology and Chronic Health Evaluation (APACHE) [20], and the Mortality Probability Model (MPM) [21]. However, the complexity and time constraints associated with these scoring systems limit their use in large population-based databases. Comorbidity has been shown to be an important determinant of ICU outcome [22,23]. Considering CCI in the patients admitted to an ICU will be helpful for predicting the long-term survival rate. In future study of ICU admission in association with mortality, it is better to accumulate evidence using CCI as well as a physiological illness severity scoring system.
We analyzed the data of hospitals with at least 300 beds; in these large hospitals, there was no significant change in the number of patients admitted to the ICU over the study period. The long-term mortality rate of ICU patients was significantly lower in larger versus smaller hospitals (31.15% vs. 39.88, respectively). Compared with large hospitals, the adjusted HR of long-term mortality in small hospitals was 1.25 (95% CI, 1.18 to 1.33). Additional analysis was performed on the characteristics of the patients according to number of hospital beds. For males, those with higher income and a CCI of 3 or greater tended to be admitted to large hospitals (Supplementary Table 4). It is important to understand the differences in the characteristics of large hospitals and small hospitals for preparation in future ICUs to prevent unbalanced inflow to large hospitals.
In our study, the mortality rate was highest for respiratory diseases and lowest for trauma and poisoning. There was no significant change in the crude HR of mortality over the study period; however, there was a significant difference in the adjusted HR. When analyzing admission reasons, there were no temporal trends toward a reduction in mortality, except for that due to cardiovascular disease. The HR of cardiovascular disease continued to decline from 2003. The reduction in mortality rate of the overall patient population was attributed to a decrease in mortality of patients hospitalized for cardiovascular disease. To our knowledge, there have been no previous reports on temporal trends in mortality by disease type among all patients admitted to ICUs in the Republic of Korea. There are many possible reasons for the reduction in mortality rate of cardiovascular disease, such as development of superior interventions, increased awareness of acute myocardial infarction among doctors and the general public, and improved care in coronary care units in recent decades [24]. We need to build a systematic database of diseases that have not shown improved survival rates over the past years, analyze the causes, and make improvements.
Our study had some limitations. First, we did not include widely used scoring systems. Second, the reason for ICU admission was based on the main diagnosis at admission, which may not always have corresponded to the actual reason for hospitalization. Despite these limitations, this study is important because it is first to analyze the characteristics and mortality rates of Korean ICU patients based on a nationally representative cohort.
From 2003 to 2010, the number of ICU admissions in the Republic of Korea increased, as did the age and disease severity of the patients. Meanwhile, the HR of long-term mortality gradually declined; in an analysis according to main diagnosis, this seemed to be due to the reduction in mortality rate of cardiovascular disease. Our research will be important in understanding the epidemiology of Korean ICU admission and preparing for change.
KEY MESSAGES
▪ From 2003 to 2010, patients admitted to the intensive care unit (ICU) in the Republic of Korea were older and had higher Charlson Comorbidity Index (CCI) scores.
▪ The ICU mortality was higher in males, elderly, those with a lower household income and higher CCI score.
▪ From 2003 to 2010, there was a temporal trend toward a decrease in the hazard ratio of long-term mortality in ICU admissions.
Notes
No potential conflict of interest relevant to this article was reported.
Acknowledgements
This study was supported by 2015 Research Grant from Kangwon National University (No. 520150347). This study used National Health Insurance Service-National Sample Cohort data (NHIS-2018-2-112), made by National Health Insurance Service.
SUPPLEMENTARY MATERIALS
The online-only Supplement data are available with this article online: https://doi.org/10.4266/acc.2018.00164.