Feasibility study of incident dark-field video microscope for measuring microcirculatory variables in the mouse dorsal skinfold chamber model
Article information

Abstract
Background
Despite the importance of microcirculation in organ function, monitoring microcirculation is not a routine practice. With developments in microscopic technology, incident dark field (IDF) microscopy (Cytocam) has allowed visualization of the microcirculation. Dorsal skinfold chamber (DSC) mouse model has been used to investigate microcirculation physiology. By employing Cytocam-IDF imaging with DSC model to assess microcirculatory alteration in lipopolysaccharide (LPS)-induced endotoxemia, we attempted to validate availability of Cytocam-IDF imaging of microcirculation.
Methods
DSC was implanted in eight BALB/c mice for each group; control and sepsis. Both groups were given 72 hours to recover from surgery. The sepsis group had an additional 24-hour period of recovery post-LPS injection (4 mg/kg). Subsequently, a video of the microcirculation was recorded using Cytocam. Data on microcirculatory variables were obtained. Electron microscopy was implemented using lanthanum fixation to detect endothelial glycocalyx degradation.
Results
The microcirculatory flow index was significantly lower (control, 2.8±0.3; sepsis, 2.1±0.8; P=0.033) and heterogeneity index was considerably higher (control, 0.10±0.15; sepsis, 0.53±0.48; P=0.044) in the sepsis group than in the control group. Electron microscopy revealed glycocalyx demolishment in the sepsis group.
Conclusions
Cytocam showed reliable ability for observing changes in the microcirculation under septic conditions in the DSC model. The convenience and good imaging quality and the automatic analysis software available for Cytocam-IDF imaging, along with the ability to perform real-time in vivo experiments in the DSC model, are expected to be helpful in future microcirculation investigations.
INTRODUCTION
Microcirculation is the smallest part of the entire cardiovascular system and its essential role is the transport of oxygen to parenchymal cells in order to maintain organ function. It comprises functional units of vessels < 100–150 micrometers in diameter, namely arterioles, venules, and capillaries [1]. Macrocirculatory function is controlled through systemic perfusion pressure to match oxygen delivery to metabolic demands of individual organs, in contrast, microcirculatory function is strongly influenced by the vascular tone within the system. In times of crisis, as shock state develops, microcirculation may play pivotal role in critical illness progression. Most vital monitoring devices focus on macrocirculatory measures, such as stroke volume, cardiac output, heart rate, central venous pressure and mean arterial pressure, based on the hypothesis that changes in microcirculatory perfusion occur in parallel to those in macrocirculatory perfusion. However, several studies have shown that during shock state, restoration of the macrocirculation is not necessarily correlated with the recovery of the microcirculation to baseline levels [2-4]. This phenomenon has been explained as the “loss of hemodynamic coherence,” and it emphasizes the need for expansion of macrocirculation-focused vital monitoring to encompass the microcirculation [5].
Since the development of direct intravital observation method of nailfold capillary bed in the 20th century using bulky capillary microscopes, techniques to visualize the microcirculation have been limited to handheld bed side instrument using orthogonal polarization spectroscopy (OPS) and sidestream dark field (SDF) imaging. Despite their extensive utilization for microcirculatory system visualization, they have limitations; inability to achieve automatic microcirculation analysis, pressure-induced microcirculatory alterations caused by heavy weight of the device (an SDF camera weighs 320 g), inconvenience of manual focusing, and poor quality of acquired images. With the recent development of light weight (120 g), fully digitalized pen-like device (length, 220 mm; diameter, 23 mm) incorporating incident dark field (IDF) illumination [6], the Cytocam-IDF video microscope provides enhanced acquisition of microcirculatory images. Dark-field microscopy allows visualization of the microcirculation by means of epi-illumination, without the requirement of illumination from below the tissue as would be required in standard bright field microscopy [7].
For the past two decades, dorsal skinfold chamber (DSC) has been widely used to explore microcirculation physiology. The model is based on chronic implantation of an observation chamber on the dorsal skinfold of rats, hamsters or mice. The DSC model has several advantages; it can be horizontally positioned under a microscope or used for repetitive noninvasive intravital microscopy using trans-illumination or fluorescence epi-illumination, once placed, continuous observation for 2–3 weeks is possible, and it can also be used in implantation or regenerative studies [8].
Sepsis has high prevalence and is the most common cause of death in intensive care unit [9], and has been recently reported as the final common pathway of death when dying from infection [10]. The microcirculation is severely altered in septic shock due to inflammation and massive cytokine release, causing sepsis induced microvascular dysfunction [11], endothelial and glycocalyx damage [12], and pathological shunting and heterogeneous perfusion [13]. This further accentuate the importance of microcirculation monitoring in sepsis and its potential utility as an indicator of treatment response or prognosis. However, there is no known definitive treatment for impaired microcirculation to date, and further research on this subject is needed.
The aim of this study is to evaluate microcirculation under control and septic condition and to validate the ability of Cytocam-IDF video microscope for assessing the microcirculatory state. Therefore, we examined the application of the Cytocam-IDF video microscope in observing the microcirculation of DSC of BALB/c mice. The DSC allows in vivo pathophysiological studies on vascularization, and the Cytocam provides direct visualization of the microvascular network in real time. Based on this premise, we consider Cytocam-IDF video microscopy for DSC of BALB/c mice to be an ideal model to observe differences in microcirculation between lipopolysaccharide (LPS)-induced septic and control conditions, and try to validate its ability in assessing microcirculatory variables. In addition, to confirm microvascular dysfunction in septic conditions, glycocalyx layer thickness was estimated using electron microscopy (EM).
MATERIALS AND METHODS
Ethical Statement
All experimental protocols were approved by the Biomedical Research Institute (No. PNUH-2019-145; December 13, 2019). All procedures were performed in accordance with the policies of the Institutional Animal Care and Use Committee (IACUC090017).
Animal Preparation
Experiments were performed using 8- to 12-week-old male BALB/c mice (Koatech, Pyeongtaek, Korea) weighing 24–28 g. The mice were kept in isolator rack in a 12-hour light-dark cycle with free access to water and standard chow under controlled temperature (23°C ± 1°C) and humidity (50% ± 10%) conditions. All mice were weighed before implantation of DSC window (baseline) and IDF video recording.
DSC Model
The employed surgical technique was adapted from that described by Seynhaeve and Ten Hagen [14]. All preparation and surgeries were performed with sterile instrument. The titanium dorsal chamber (Small dorsal kit; APJ trading, Ventura, CA, USA) weighing 2 g can be autoclaved and reused. The surgical procedure of mounting the DSC starts with anesthesia of the mouse with 4% isoflurane in 1 L/min oxygen in small anesthetic chamber for rodents. When deeply anesthetized, animals were placed in sternal recumbency on a 32°C warm-plate and fitted with a facial mask delivering isoflurane 1.5%–2.0% in 1 L/min oxygen. Before chamber implantation, the entire back of the animal was shaved and chemically depilated. For balance of the chamber, midline and chamber window space were drawn with sterile skin pen, as shown in Figure 1A. Two main frames were implanted to sandwich the extended double layer of the dorsal skin. A 15-mm-diameter circular area of skin on the anterior side of the chamber was removed, and the remaining layer (observational window) was covered with a glass cover slip. The glass cover slip was fixed with the retaining ring (Figure 1B). During the procedure, the observational window was kept moist with sterile normal saline. To help prevent infection, topical antibiotic ointment (Parason Ointment, Sodium Fusidate; SK Chemicals, Seongnam, Korea) was applied to all screw, suture, and edge of wound area. Postoperatively, the animal was placed on a 32°C warm-plate until it awoke from anesthesia. For analgesic purposes, meloxicam 5 mg/kg was injected subcutaneously after surgery. No changes in eating or sleeping habits were observed in the animals. The mice’s mobility was not constrained after mounting of the chamber.

Markings made prior to dorsal skinfold chamber (DSC) implantation (A). Completion of DSC implantation; note the placement of glass cover slip below the retaining ring (B).
LPS-Induced Septic Model
The mice were randomly divided into two groups: one (sepsis group, n = 8) group received intraperitoneal (IP) administration of LPS (Escherichia coli O55:B5; Sigma Aldrich Co., St. Louis, MO, USA) 2 mg/kg at 0 and 18 hours after DSC implantation recovery period according to study design described by Kataoka et al. [15], and the other (control group, n = 8) group received IP injections of equivalent amount of sterile normal saline. The volume of injected LPS and sterile normal saline was 4 μl/g per injection. Twenty-four hours after the first injection of LPS, the microcirculation was recorded, and the mice was perfused with fixation solution for EM.
Microscopic Measurements and Analysis
The microcirculatory network was evaluated in the dorsal skinfold by means of an IDF illumination device (Cytocam, Braedius Medical, Huizen, The Netherlands). During each microscopic observation, animals were positioned in an acrylic resin tube with an inner diameter of 26 mm while conscious. The tube was placed on a 32°C warm-plate for microscopic image acquisition. The retaining ring and the glass cover slip was removed for direct contact of observational window with the microscope (Figure 2). A video image corresponding to 5 seconds (25 frames per second) of vessel flow was obtained from three different sites per mouse in accordance with the second consensus on the assessment of sublingual microcirculation from European Society of Intensive Care Medicine [16]. The videos were captured and processed using software (CytoCamTools V2 Research Edition Camera Manager, Braedius Medical).

Image taken after removal of the retaining ring and glass cover slip (A). Direct contact of the observational window with green light emitting microscope (B).
Image quality was assessed by applying a composite score system of six categories: illumination, duration, focus, content, stability and pressure, and videos are assigned a score of 0 = good, 1 = acceptable, or 10 = unacceptable for each category. If image quality was unacceptable (image quality score [IQS] > 10) in more than one category, the said image was discarded [17]. Video acquisition was achieved, and the IQS were assessed by discussion between the two trained researchers. Videos of acceptable quality were analyzed offline. For variables of capillary flow, microvascular flow index (MFI) and proportion of perfused vessels (PPV), and for capillary density, total vessel density (TVD), perfused vessel density (PVD), De Backer score and heterogeneity index (HI) for flow distribution were obtained. The image was divided into four quadrants; a score was assigned for each quadrant according to the predominant type of flow (0 = no flow, 1 = intermittent flow, 2 = sluggish flow, 3 = continuous flow). The final MFI was the average value of the four quadrants per video and acted as a semi-quantitative measure of perfusion quality. The De Backer score was calculated by a line-crossing method and is based on the principle that density of the vessels is proportional to the number of vessels crossing arbitrary lines consisted of three equidistant horizontal and three equidistant vertical lines drawn on to the screen TVD (mm/mm2) was calculated as the total length of vessels divided by the total area of the image. The PPV was estimated as follows: 100×[{total number of grid crossings–(no flow+intermittent flow)}/total number of grid crossings] and expressed as a percentage. The PVD (mm/mm2) was estimated by multiplying TVD by the PPV using the De Backer method. The HI was calculated as the highest MFI minus the lowest MFI divided by the mean MFI of all four quadrants [16-18]. The De Backer score, TVD, PPV, and PVD were automatically analyzed using software CytoCamTools V2 Research Edition Analysis Manager (Braedius Medical). For statistical analyses we used the average De Backer score, MFI, TVD, PVD and PPV of three recordings per animal.
Electron Microscopy
To view the endothelial glycocalyx using EM, after slight nick of right atrium, mice were perfused via the left ventricle with a fixative/staining solution composed of 2% glutaraldehyde, 30 mM 4-(2-hydroxyethyl)-1-piperazineethanesulfonic acid buffer, and 2% La(NO3)3 for 30 minutes at a speed of 1.5 mL/min using a perfusion pump. Diced pieces of the dorsal skin were immersed in 2.5% glutaraldehyde fixative solution (4°C, phosphate buffer, pH 7.2) and post-fixed with 1% osmium tetroxide in the same buffer. After dehydration with a graded series of ethyl alcohol, the sample were embedded in epoxy resin (Epon 812 mixture). Thick sections (1 μm) were stained with 1% toluidine blue for light microscope. Thin sections (50–60 nm) were prepared by using an ultra-microtome (EM UC7; Leica, Wetzlar, Germany) and double stained with uranyl acetate and lead citrate. Thin sections were examined using transmission EM (JEM-1200EX II; JEOL, Tokyo, Japan). Images were analyzed using Image J (https://imagej.nih.gov/ij/). Quantitative assessment of the endothelial glycocalyx thickness within the capillary lumen was performed on six randomly chosen sites in transmission EM scans.
Statistical Analysis
For a power of 0.9 and a two-sided α level of 0.05, a sample size of seven mice in each group was considered to be appropriate to detect a 1.0 difference of MFI between the groups. Considering a drop-out rate of 10%, eight mice were included in each group. The measured data are expressed as the mean±standard deviation or median (interquartile range). All continuous variables were accessed for normality using Kolmogorov-Smirnov test. Differences between groups were analyzed using the unpaired Student t-test or Mann-Whitney U-test for nonparametric data, which includes PVD and HI. Weight changes were analyzed using repeated measures analysis of variance (ANOVA) with Bonferroni post-hoc test. Categorical variables were compared using the chi-square test. Statistical significance was set at P<0.05. All analyses were performed using IBM SPSS ver. 25.0 (IBM Corp., Armonk, NY, USA).
RESULTS
A total of 16 animals were analyzed in our study. Repeated measured ANOVA showed no differences in weight between the groups. In both groups, weight was profoundly lower 4 days after DSC implantation than that at baseline. The baseline body weight in both groups did not differ significantly. All results of mean values are presented in Table 1.

Weight change
In total, 48 videos were collected and analyzed offline (Supplementary Videos 1 and 2). The quality of the recorded microcirculatory video of control group scored slightly better than that in the sepsis group, although the difference was not significant (IQS: control, 0.9 ± 1.2; sepsis, 1.2 ± 1.3; P=0.617). Microcirculatory variables are described in Table 2. The MFI was significantly lower in the sepsis group (MFI: control, 2.8 ± 0.3; sepsis, 2.1 ± 0.8; P=0.033), while the HI was higher (HI: control, 0.10 ± 0.15; sepsis, 0.53 ± 0.48; P=0.044). The De Backer score, TVD, PPV and PVD did not differ significantly between two groups (Table 2). Glycocalyx thickness was 0.100 ± 0.030 μm in the control group, significantly higher than the value of 0.002 ± 0.020 μm in sepsis group (P<0.001) (Figure 3).
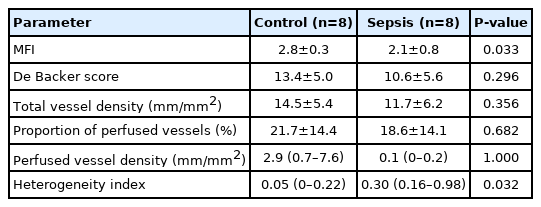
Microcirculatory variables
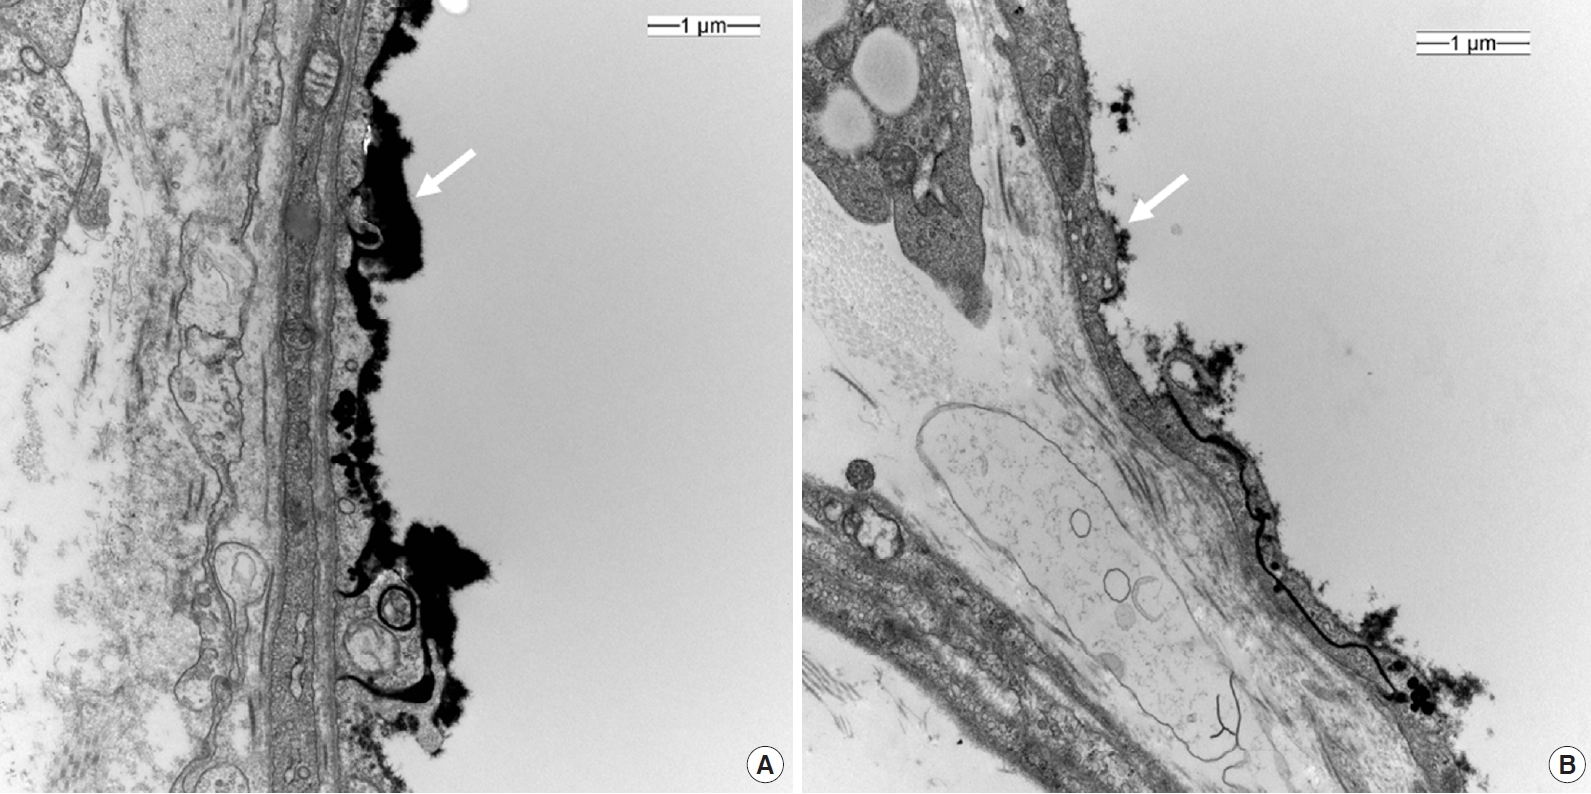
Electron microscopy of a cross section of dorsal skin vessel; control (A) and sepsis (B). ×20,000; white arrow, lanthanum nitrate-stained glycocalyx layer.
DISCUSSION
In present study, we examined microvascular properties in dorsal skinfold of BALB/c mouse using Cytocam-IDF imaging system under both healthy and septic conditions; with these data, we demonstrated that microcirculatory features can be detected and differentiated in vivo in real time. The differences in microcirculatory features measured using IDF imaging between control and sepsis groups were confirmed by the difference in degradation of glycocalyx shown in EM.
In Cytocam-IDF imaging system, after analysis of the recorded video by designated software, an analysis report was created contained the properties of vessel density (TVD and PVD), perfusion indices (PPV and MFI) and flow heterogeneity (HI). MFI and HI are a semi-quantitative measurement based on grid separation [19]. According to our primary outcome, MFI was significantly lower and HI was significantly higher in sepsis group than in the control group. The pathophysiology of sepsis involves triggering of an inflammatory response, producing and releasing a large number of inflammatory cytokine; this increases leukocyte trafficking [20]. Red blood cells lose their ability to release vasodilators, acquire cell deformities; and easily aggregate, resulting in micro-thrombi formation and capillary plugging [21]. These abnormalities are not detected on conventional hemodynamic monitoring systems but can be identified based on microcirculatory variables: reduced functional capillary density (FCD), which represents the number of spontaneously perfused capillaries per analyzed tissue area; reduced overall microcirculatory flow; and increased flow heterogeneity (Supplementary Videos 1 and 2). In a similarly designed study of mouse DSC model using laser Doppler imaging technique, endotoxemia group had decreased mean perfusion (percentage of control) to 17.1%±0.6% at 24 hours in response to LPS (P<0.01) [22]. Moreover, Yeh et al. [23], observed intestinal microcirculatory function of rat in vivo, real time with SDF imaging and LPS treated group had significantly lower PPV and MFI and higher HI compared with sham group without LPS treatment.
In clinical environment, with evaluation of sublingual microvasculature using OPS imaging in 86 patients, patients with sepsis had significantly decreased vessel density and lower PPV [24]. Remarkable point of this study was that previous results was separate of changes of mean arterial pressure and need for vasopressor medications. Additional study of 46 septic shock patients revealed at the onset of shock, survivors and non survivors had similar vascular density and PPV [25]. At the end of shock however, survivors had relatively improved microvascular function, as opposed to persistent alterations in non survivors. These aforementioned studies are in relevance with our study findings and also in align with our hypothesis.
The glycocalyx is a layer composed of proteoglycans, glycoproteins bound with sialic acid, glycosaminoglycans, and associated plasma proteins that lines the luminal surface of vascular endothelial cells [26]. It functions as barrier to control vascular permeability by establishing a transvascular albumin gradient. An intact glycocalyx regulates transvascular fluid flux and is therefore closely related to microvascular system. In sepsis, the glycocalyx is degraded, and the layer becomes thinner and sparser, allowing plasma proteins and fluid to move unregulated across the vascular wall. This degradation releases glycocalyx components, such as syndecan-1, heparin sulfate, hyaluronan, chondroitin sulfates, into the plasma [26]. Studies have demonstrated that syndecan-1 shedding is associated with both the presence and severity of sepsis [27]. Hence, it has been hypothesized that glycocalyx degradation may lead to major microcirculatory dysfunction, glycocalyx thickness can be an indication of septic conditions. Its observed thickness in mice is approximately 0.50 μm [28]. Our EM scans revealed a greater reduction in glycocalyx thickness in the sepsis group than in the control group. This was well correlated with the Cytocam-IDF measured MFI results.
Out study has several limitations. TVD and PVD are calculated variables, while PPV is a measured variable. The evaluation of PPV allows no distinction to be made between normal, sluggish and hyperdynamic flows but it provides information on flow heterogeneity within the image. PVD provides an accurate estimate of FCD. The MFI score differentiates between the types of flow which are continuous, sluggish and intermittent, in addition to making distinction between perfusion and non-perfusion. In conditions where homogenous flow is present, the MFI score can provide additional information without the estimation of capillary density. In heterogeneous conditions, the PPV should be used to estimate FCD [19]. In the septic state, the PVD and PPV should be decreased and the TVD should be unaffected; however, the present study failed to produce these expected results. This inconsistency may be due to wound inflammation. During the experiment, it was difficult to record the microcirculation video in mice with more inflamed wounds. Such wounds produce excessive fluid, thereby affecting video focus, leading to difficulties in accurately recording the microvascular system. Theoretically, in the early inflammatory phase of wound healing, vascular sprouts and newly formed microvessels within the wound margins would be visualized using IDF [8]. In addition, our original intention was to emphasize the dissimilarity between microcirculation variability and macrocirculation. However, we did not measure macrocirculation-related hemodynamic variables; therefore, we were unable to compare between microcirculation and macrocirculation properties.
According to our study, the MFI and HI well correlated in the sepsis model compared with that in the control group, and this finding alone could be used for the validation of the Cytocam-IDF imaging system in monitoring microcirculation system for progression of inflammatory illnesses. The convenience of use, good image quality, and automatic analysis software in Cytocam-IDF imaging, along with the advantages of the ability to perform real-time in vivo experiments in the DSC model, are expected to be helpful in future microcirculation investigations.
KEY MESSAGES
▪ Detection and assessment of early changes in the microcirculation are helpful in delaying critical illness progression.
▪ The dorsal skinfold chamber model has been used for microcirculatory studies, owing to the advantage of real-time and in vivo observation.
▪ Cytocam-incident dark field imaging is a convenient tool for exploration of microcirculation when applied to the dorsal skinfold chamber model.
Notes
CONFLICT OF INTEREST
No potential conflict of interest relevant to this article was reported.
AUTHOR CONTRIBUTIONS
Conceptualization: ARC. Data curation: ARC, EJK, DM. Formal analysis: CK, ARC, DM. Funding acquisition: ARC. Methodology: CK, ARC, EJK. Project administration: HJL. Visualization: CK, ARC, HJK, SJ, JMH. Writing–original draft: CK, ARC. Writing–review & editing: all authors.
Acknowledgements
This work was supported by a National Research Foundation of Korea (NRF) grant funded by the Korean government (Ministry of Education, Science and Technology; MEST) (No. NRF-2018R1C1B5040928).
SUPPLEMENTARY MATERIALS
Supplementary materials can be found via https://doi.org/10.4266/acc.2020.00969.
Microcirculation flow in septic condition.
Microcirculation flow in control condition.