Association of nutrition risk screening 2002 and malnutrition universal screening tool with COVID-19 severity in hospitalized patients in Iran
Article information

Abstract
Background
Malnutrition affects normal body function and is associated with disease severity and mortality. Due to the high prevalence of malnutrition reported in patients with coronavirus disease 2019 (COVID-19), the current study examined the association between malnutrition and disease severity in hospitalized adult patients with COVID-19 in Iran.
Methods
In this prospective observational study, 203 adult patients with COVID-19 verified by real-time polymerase chain reaction test and chest computed tomography were recruited from those admitted to a university hospital in Iran. To determine COVID-19 intensity, patients were categorized into four groups. Malnutrition assessment was based on the Malnutrition Universal Screening Tool (MUST) and nutrition risk screening score (NRS-2002). An ordinal regression model was run to assess the association between malnutrition and disease severity.
Results
In the studies sample of Iranian patients with COVID-19, 38.3% of patients had severe COVID-19. According to NRS-2002, 12.9% of patients were malnourished. Based on MUST, 2% of patients were at medium, and 13.4% of patients were at high risk of malnutrition. Malnutrition was associated with a higher odds of extremely severe COVID-19 according to NRS-2002 (odds ratio, 1.38; 95% confidence interval, 0.21–2.56; P=0.021).
Conclusions
Malnutrition was not prevalent in the studies sample of Iranian patients with COVID-19; however, it was associated with a higher odds of extremely severe COVID-19.
INTRODUCTION
Nutrition has a vital role in proper immune function [1], and consequently, malnutrition has been shown to be associated with impaired normal body function [2], such as disease severity in patients with respiratory viral infections [3], influenza severity [4], and mortality [5]. Coronavirus disease 2019, coronavirus disease 2019 (COVID-19), is primarily a respiratory viral disease known as severe acute respiratory syndrome coronavirus 2 (SARS-CoV-2) infection [6]. Based on the literature, malnutrition is prevalent in patients with COVID-19 [7-9]. During the acute inflammatory response to the SARS-Cov-2 infection, muscle protein is utilized to make inflammatory markers such as C-reactive protein, ferritin, tumor necrosis factor-alpha, and interleukin family factors [10]. So, the malnourished condition is associated with impaired immune response [11]. Age, community-acquired pneumonia, and hospital-acquired pneumonia are malnutrition risk factors in patients with COVID-19 [9]. Surprisingly, a compromised cellular immune system may operate as a protective factor against severe SARS-Cov-2 infection due to a lack of T-cell activation. Hyperimmune response and consequent cytokine storm are often linked with severe COVID-19, and this might be "balanced" by the impaired immune response seen in individuals with malnutrition-induced leptin deficit [12].
The Malnutrition Universal Screening Tool (MUST), is a score used to determine the risk of malnutrition. This score is calculated using three parameters: body mass index (BMI) upon presentation, percentage of total body weight lost in the preceding 3–6 months, and presence of acute illness in the preceding 5 days [13]. Nutrition risk screening score (NRS-2002) is another approach for nutritional risk assessment. It contains three variables: the severity of the illness, nutritional state, and age [14].
Given what has been said, there is a need for more studies to assess the association between malnutrition and disease severity in patients with COVID-19. In addition, based on the best of our knowledge, no study has examined the connection between malnutrition and disease severity in these patients in Iran. Therefore, this study aimed to examine the association between malnutrition with disease severity and clinical outcomes in adult patients with COVID-19 using NRS-2002 and MUST scoring tools.
MATERIALS AND METHODS
Study Setting and Population
This is a single-center, prospective, observational, sex-matched study on the patients admitted to the Baqiyatallah Hospital from October 2021 to November 2021 in Tehran, Iran. According to previous studies, the prevalence of malnutrition in hospitalized patients based on NRS-2002 in Iran is about 40% [15]. By considering 95% of the confidence interval (CI) and d=0.07, the sample size was calculated, 184 patients. All admissions to the COVID ward were checked using the hospital's electronic database. Patients aged 18 years and older with COVID-19 verified by real-time polymerase chain reaction test and chest computed tomography (CT) were included in the research. Patients who were unable to obey directions, answer questions, stand to be weighed, need maternity or psychiatric care, had missing data from their medical records (e.g., no total lymphocyte count or serum albumin findings), breastfeeding/pregnant women, and those who did not want to enter the study for any reasons were not included in this study. Two hundred and three patients who met the study's criteria were called to participate and provided written informed permission. Patients’ birthdate, sex, medical history (type 2 diabetes mellitus, hypertension, cardiovascular disease, respiratory disease, chronic kidney disease, cancer, gastrointestinal disease, surgery history, fever, dyspnea, anorexia, and lethargy) were obtained from their medical records. Height and weight were also measured on admission. The BMI was computed by dividing the individual's weight in kilograms by the square of the individual's height in meters.
COVID-19 and Laboratory Assessments
Laboratory assessments included white blood cell, red blood cell, lymphocytes (%), hemoglobin (Hb), platelet, C-reactive protein (CRP), lactate dehydrogenase (LDH), Ferritin, D-dimer, and creatine phosphokinase test (CPK). Individuals had their antecubital veins punctured to get venous blood in the morning. Ethylenediaminetetraacetic acid (EDTA)-containing tubes were used to collect blood samples, maintained at room temperature for 15 to 30 minutes. At 4°C, plasma was centrifuged for 10 minutes at 3,000 rpm. The serum collected was thus kept at –20°C until it was time for testing in the laboratory.
To define COVID-19 intensity, patients were categorized into four groups based on the clinical symptoms and laboratory test results. For mild, the symptoms are mild, and the patient does not have pneumonia according to the CT-scan. For common, the patient has a fever, respiratory problems, and other symptoms and has mild pneumonia due to CT scan. For severe, the patient has one of the following conditions: (1) shortness of breath: ≥30 breaths per minute, (2) pulse oxygen saturation <93% at the resting state, or the ratio of arterial blood oxygen pressure (PaO2) to oxygen concentration (FIO2) less than 300 mm Hg. For extremely severe, the patient has at least one of the following conditions: (1) respiratory failure and need for the mechanical ventilator, (2) shock or (3) combined organ failure and the need for further monitoring in an intensive care unit (ICU) [16].
Malnutrition Assessments
The NRS-2002 ranges from 0 to 7. Based on NRS-2002, patients were categorized into two groups: those with NRS-2002 <3 have been stated as normal (no risk of malnutrition), and those with ≥3 have been stated as nutritionally at risk (patients with malnutrition). NRS-2002 has been approved, validated, and used extensively to screen nutritionally at-risk hospitalized patients [17-19]. The MUST score determines malnutrition risk by three independent criteria: current weight by using BMI, unwanted weight loss, and acute disease effect that has induced not receiving food for more than 5 days. According to the total score, patients were defined as low risk of malnutrition (score=0), medium risk of malnutrition (score=1), or high risk of malnutrition (score ≥2) [20].
Statistical Analysis
IBM SPSS was used to do statistical analysis (version 20; IBM Corp., Armonk, NY, USA). A P<0.05 was considered statistically significant. All P-values were considered two-tailed. The Kolmogorov-Smirnov test, histogram, and Q-Q plot were used to assess the normality of the continuous data. The median (Q1–Q3) was used to convey quantitative data, whereas qualitative data were presented as numbers (percent). Analysis of the distribution of categorical variables was done using the chi-square test; the Mann-Whitney test was used to examine the distribution of non-normal variables. Quantitive variables across COVID-19 intensity were examined by analysis of covariance. To examine the association between malnutrition and COVID-19 intensity, an ordinal regression model was run. The categories for COVID-19 intensity and malnutrition scores have been mentioned. As an exception for MUST, due to the small number of patients in the moderate malnutrition category, those with a MUST score ≥1 are defined as patients with medium/high risk of malnutrition.
Ethical Statement
The research was conducted according to the Helsinki Declaration and its later revisions. The Ethics Committee of Baqiyatallah University of Medical Sciences authorized the present study (ethic code: IR.BMSU.RETECH.REC.1399.481), and before being included in the investigation, all patients gave their written informed.
RESULTS
Of the 203 participants who entered the study, two were excluded due to lack of information, and finally, 201 patients were included for analysis. 24 (11.9%) of participants had mild COVID-19, whereas 59 participants (29.4%) had moderate, 77 participants (38.3%) had severe, and 41 patients (20.4%) had extremely severe disease (Figure 1). According to the NRS-2002, 175 patients (87.1%) had no risk of malnutrition, and 26 patients (12.9%) were malnourished. Of those with malnutrition, 61.5% and 38.5% were hospitalized at a non-intensive unit and ICU, respectively. Based on MUST, 170 patients (84.6%) were at low risk of malnutrition, while 4 (2%) of them were at medium risk, and 27 patients (13.4%) were at high risk. Nearly 58 % of patients with medium/high risk of malnutrition were admitted to ICU, based on MUST.

Flow diagram for patients recruitment. COVID-19: coronavirus disease 2019.
Baseline characteristics of patients have shown in Table 1 according to the COVID-19 intensity. A significant difference according to age was seen between COVID-19 intensity categories, and patients with extremely severe COVID-19 were older than others (P=0.001). There was also a significant difference in the distribution of patients according to the hospitalization ward, fever experience (P<0.001), and dyspnea (P=0.009). Patients with extremely severe COVID-19 had the most weight loss during the disease persistence (P=0.031). The Haemoglobin-oxygen (Hb-O2) was significantly lower in those with extremely severe COVID-19 (P<0.001). CRP and CPK were significantly higher in those with severe COVID-19 (P<0.001). Besides, those with extremely severe COVID-19 had significantly higher ferritin (P<0.001) and LDH (P=0.015).

Baseline characteristics of patients with COVID-19 according to COVID-19 intensity
Table 2 shows the association between malnutrition scores and COVID-19 intensity among Iranian COVID-19 patients. The association between malnutrition and COVID-19 intensity showed that nutritionally at risk patients based on NRS-2002 had more than 2 times higher odds for extremely severe COVID-19 in crude model (odds ratio [OR], 2.14; 95% CI, 1.29–2.98; P<0.001). After adjusting for confounding variables including age, hospitalization ward, fever, dyspnea, weight loss during COVID-19, Hb-O2, CRP, LDH, ferritin, D-dimer, and CPK, odds for extremely severe COVID-19 baceme 1.38 times higher in malnourished patients (OR, 1.38; 95% CI, 0.21–2.56; P=0.021). Based on the MUST score, patients who were at medium/high risk of malnutrition, had significantly higher odds for extremely severe COVID-19 in the crude model (OR, 2.29; 95% CI, 1.48–3.10; P<0.001), however this association was not significant after adjusting for confounders (OR, 1.08; 95% CI, –0.56 to 2.21; P=0.062).
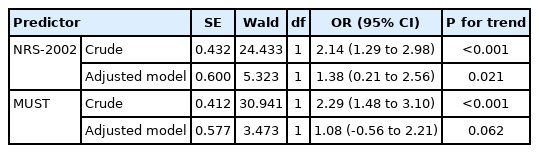
Ordinal regression (stepwise manual) with COVID-19 intensity as the dependent variable
DISCUSSION
In this study, we found that most hospitalized patients with COVID-19 were not nutritionally at risk based on NRS-2002 and MUST. The majority of malnourished patients diagnosed by NRS-2002 were in the non-intensive unit. However, the majority of malnourished patients, according to MUST, were admitted to ICU. In contrast, according to Bedock et al. [7], 42.1% of patients with COVID-19 had malnutrition, and 18.4% were severely malnourished, and most malnourished patients were from ICU admitted patients. In another study, Li et al. [8] reported a high prevalence of malnutrition in elderly patients with COVID-19 using Mini Nutritional Assessment. During the acute inflammation caused by COVID-19, that defined by elevated inflammatory markers including CRP, degradation of muscle proteins is an important reason for malnutrition [10]. In the current study, patients with severe and extremely severe COVID-19 had higher CRP. It is reported that CRP may be associated with the development of COVID-19 [21,22].
The study showed a significant association between malnutrition and extremely severe COVID-19. Kurtz et al. [23] reported that a previous diagnosis of malnutrition is associated with severe COVID-19. On the other hand, severe COVID-19 may remain a risk factor for long-lasting malnutrition, and nutrition support should be addressed in these patients, especially those admitted to ICU [24]. Malnutrition in hospitalized patients is directly associated with length of hospitalization and mortality [25-27]. Malnutrition causes immune-enhancing trace elements deficiency, which worsens the immune system function [28]. Besides, COVID-19 is associated with symptoms including anorexia, and fewer than all lead to catabolic status, muscle waste, and weight loss [29].
The current study has some limitations. Being single-center would cause selection bias. We did not consider some risk factors, including serum albumin, physical activity, and dietary intakes. No nutritional screening tool is considered the accepted gold standard for the assessment of nutritional status [30]. However, Velasco et al. showed NRS-2002 and MUST should be used to screen for nutritional status at admission in hospitalized patients [31]. It would be better to use Global Leadership Initiative on Malnutrition-specific metrics to diagnose malnutrition [32]. Although the study was sex-matched, it would be better to consider age as another matching factor. The sample size may have caused insufficient power for examining the association between malnutrition and COVID-19 intensity. However, the study had some strengths. To our knowledge, it was the first study in Iran to assess the association between malnutrition diagnosed by NRS-2002 and MUST with COVID-19 intensity.
To bring together, although the prevalence of malnutrition was low in the study population, malnutrition was directly associated with extremely severe COVID-19. According to the study design, it is unclear whether malnutrition was caused by extremely severe COVID-19 or was a factor leading to it. However, considering the nutritional status of patients, especially the elderly, is an important factor in decreasing mortality and morbidity.
Key Message
▪ Although coronavirus disease 2019 (COVID-19) is related to a catabolic inflammatory condition, the majority of patients with COVID-19 were not malnourished in this study.
▪ Malnutrition was associated with a higher chance of extremely severe COVID-19.
▪ It is not obvious that severe COVID-19 causes malnutrition or it is a risk factor for disease severity.
Notes
CONFLICT OF INTEREST
No potential conflict of interest relevant to this article was reported.
AUTHOR CONTRIBUTIONS
Conceptualization: GE, MB. Data curation: SS, DAM. Formal analysis: GE, DAM. Funding acquisition: MB. Methodology: GE, MB. Project administration: MB. Visualization: KP, SS. Writing–original draft: GE, SS. Writing–review & editing: MB, all authors.
Acknowledgements
The study was supported by Baqiyatallah University of Medical Sciences, Tehran, Iran.