Perioperative hemodynamic protective assessment of adaptive support ventilation usage in pediatric surgical patients
Article information

Abstract
Background
The aim of this study was to evaluate the hemodynamic protective effects of perioperative ventilation in pressure-controlled ventilation (PCV) and adaptive support ventilation (ASV) modes based on non-invasive hemodynamic monitoring indicators.
Methods
The study included 32 patients who were scheduled for planned open abdominal surgery. Depending on the chosen ventilation strategy, patients were included in two groups of PCV mode ventilation (n=14) and ASV mode ventilation (n=18). The hemodynamic effects of the ventilation strategies were assessed by estimated continuous cardiac output (esCCO) and cardiac index (esCCI).
Results
Preoperative cardiac output (CO) was 6.1±1.3 L/min in group 1 patients and 6.3±0.8 L/min in group 2 patients, and preoperative cardiac index (CI) was 3.9±0.4 L/min/m2 in group 1 patients and 3.8±0.8 L/min/m2 in group 2 patients. The ejection fraction (EF) in group 1 subjects was 55.4%±0.3%; this rate was 56.5%±0.5% in group 2 subjects. Group 1 patients experienced a 14.7% CO decrease to 5.2±0.7 L/min, a 17.9% CI decrease to 3.2±0.6 L/min/m2, and a 12.8% mean arterial pressure decrease to 82.3±9.4 mm Hg 30 minutes after the start of surgery. One hour after the start of surgery, the CO mean values of group 2 patients were lower than baseline by 7.9% and differed from the dynamics of patients in group 1, in whom CO was lower than baseline by 13.1%. At the end of the operation, the CO values were lower than baseline by 11.5% and 6.3% in patients of groups 1 and 2, respectively. Our data showed that the changes in EF during and after surgery correlated with CO indicators determined by the esCCO.
Conclusions
In our study, perioperative ventilation in ASV mode was more protective than PCV mode and was characterized by lower tidal volume (16.2%) and driving pressure (12.1%). Hemodynamically-controlled mechanical ventilation reduces the negative impact of cardiopulmonary interactions.
INTRODUCTION
Most patients require mechanical ventilation (MV) during surgery, and optimization of intraoperative MV can reduce the incidence of postoperative pulmonary complications and improve treatment outcomes. Lung ventilators are becoming more technical and difficult to use, and low tidal volume (VT) and low positive end-expiratory pressure (PEEP) are needed when adjusting the ventilation mode. The VT needs to be calculated based on ideal, not actual, body weight. There is currently no clear evidence of the benefits of any ventilation mode.
Age, American Society of Anesthesiology (ASA) grade, functional status, type and duration of surgery, and perioperative ventilation tactics affect treatment outcome. Therefore, it is important to study protective respiratory strategies to reduce morbidity, mortality, and length of hospital stay [1]. Volume and pressure regimens are widely used in perioperative ventilation, but the superior regimen regarding patient outcomes has not been determined. With volume-controlled ventilation, a predetermined VT is supplied during inspiration via a steady flow that stops when the target volume is reached. In volume-controlled ventilation, airway pressure is a dependent variable that is affected by dynamic airway resistance and lung flexibility. Increasing resistance or decreasing flexibility can increase airway pressure, increasing the risk of barotrauma and lung damage caused by the ventilator. Abrupt changes in respiratory system compliance may occur during surgical patient positioning, leading to pneumoperitoneum during laparoscopic intervention.
With pressure-controlled ventilation (PCV), the physician selects the target peak inspiratory pressure, and the device delivers a flow that stops when the set pressure level is reached. VT is a dependent variable, and VT abnormalities can lead to dangerous hypo- or hyperventilation. Adaptive support ventilation (ASV) mode has a closed control cycle based on the mechanics of the respiratory system. Resistance and compliance are measured continuously with each breath to control the pressure and deliver the target volume. The physician enters data such as patient sex and height, and the system automatically calculates the body weight index and the appropriate volume of minute ventilation. The system then sets the target VT and respiration rate (RR) based on the feedback signal. However, VT and RR are not constant but change according to changes in resistance, compliance, and expiration constant to ensure the target volume.
With MV, there are changes in intrapleural and intrathoracic pressure and lung volume, and these changes affect the cardiovascular system. Atrial filling (preload), resistance to ventricular emptying (postload), heart rate, and myocardial contractility are all affected. Changes in intrathoracic pressure affect intrathoracic structures including the heart and pericardium and large arteries and veins. As the volume increases, the lungs exert increasing force on the heart, chest wall, and diaphragm. At the same time, the chest wall expands outward; the diaphragm lowers; and the heart, pericardium, and coronary arteries are compressed by the lungs [2]. Excessive VTs cause pulmonary bloating, which leads to impaired ventricular filling with clinical manifestations of cardiac tamponade. An acute decline in systemic venous return after starting MV is one of the most common cardiopulmonary interactions encountered in the ICU and the cause of "acute cardiovascular collapse" after intubation, a dangerous condition especially in patients with hypovolemia and septic vasodilation.
The effect of MV on the heart and hemodynamics depends on the chosen mode of ventilation and on changes in intrathoracic pressure and lung volume [3]. Different ventilatory regimens may have the same effect on hemodynamics if the intrathoracic pressure and lung volume are equal. Cardiac output (CO) is unchanged at equal VT and increases with decreasing volume [4,5]. Studies show that, when the lungs swell, the CO decreases [6]. The aim of this study was to evaluate the hemodynamic protective effects of PCV and ASV mode perioperative ventilation based on non-invasive hemodynamic monitoring indicators and ultrasound examination data.
MATERIALS AND METHODS
Following approval by the Ethics Committee of National Pirogov Memorial Medical University, Vinnytsya, Vinnytsia, Ukraine (Protocol No. 3/111), 32 patients who were scheduled for planned open abdominal surgery for tumors of the gastrointestinal tract with total intravenous anesthesia and MV were recruited. This study was conducted with written consent of all patients. Moral and ethical standards of the Helsinki Declaration of Human Rights, the Council of Europe Convention on Human Rights and Biomedicine, and relevant laws and orders of the Ukraine Ministry of Health were maintained. A brief summary of patient selection is given in Figure 1.
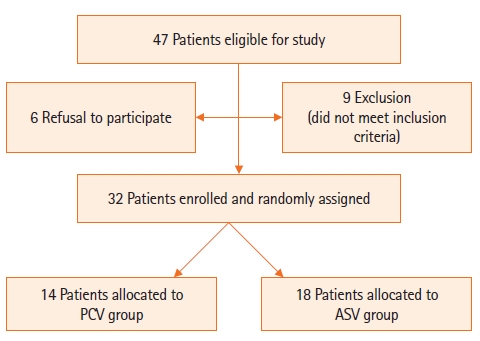
Flowchart of patient selection. PCV: pressure-controlled ventilation; ASV: adaptive support ventilation.
All patients received a standard regimen of preoperative preparation and infusion therapy during surgery. The main criteria for inclusion in the study were duration of surgery longer than 2 hours, need for postoperative ventilation for more than 12 hours, ASA patient physical status of I–III, and provision of informed consent to participate. Exclusion criteria were severe peripheral microcirculation disorder, clinically significant cardiac arrhythmia, significant damage to peripheral arteries, severe heart valve dysfunction, duration of surgery less than 2 hours, ASA physical status of IV–V, or patient refusal to participate.
The hemodynamic effects of the ventilation strategies were assessed by continuous non-invasive measurement of estimated continuous cardiac output (esCCO) and cardiac index (esCCI) by a Nihon Kohden monitor (Nihon Kohden Corp., Tokyo, Japan) and were calculated based on pulse oximetry data, ECG signals, and pulse wave transit time [7]. Additionally, the hemodynamic effects of the ventilation strategies were assessed by echocardiographic measurements with the Esaote MyLab Alpha (Esaote, Italy) using a 3-7 MHz cardiac sensor. The evaluated parameters were the linear dimensions of the right and left ventricles, end-systolic and end-diastolic volumes, and ejection fraction (EF). Diameter and degree of inferior vena cava collapse and pulmonary artery pressure as determined by estimation of maximum tricuspid regurgitation were measured.
Depending on the chosen ventilation strategy, patients were included in one of two study groups, assignment to which occurred through a random and blind selection method. The first group (n=14) included patients who underwent PCV ventilation during surgery, and the second group (n=18) included patients who underwent ASV ventilation during surgery. In both groups, a Hamilton C1 ventilator was used for MV; an intravenous anesthetic, Propofol 1%; a narcotic analgesic, Fentanyl 0.005%; and a muscle relaxant, Atracurium, were used for anesthesia.
Stages of research is as follows: before the operation, 30 minutes after the start of the operation, 1 hour after the start of the operation, at the end of the operation, and 12 hours after the end of the operation. A mathematical analysis of the results of the study was performed using computer programs Microsoft Excel 2016 (Redmond, WA, USA) and Statistica 5.5 (TIBCO Software Inc, Palo Alto, CA, USA). Comparison of statistical characteristics of groups and of dynamics of observation was performed using parametric and nonparametric criteria (considering the law of distribution). Results at P <0.05 were considered statistically significant. In addition, multivariate analysis of variance (MANOVA) with a probability less than 5% was used to determine the effect of the selected ventilation mode on ventilation and hemodynamic parameters and to establish relationships between ventilation and hemodynamic parameters.
RESULTS
A total of 32 patients was examined. Demographic indicators did not differ significantly and are presented in Table 1. The initial settings of the ventilator were as follows: (1) group 1: PCV mode; inspiratory pressure–VT=6–8 ml/kg, RR=10–14/min, inspiratory-to-expiratory ratio=1:3, PEEP=3 cm H20, and FiO2=0.4 and (2) group 2: ASV mode; MinVol=100%, PEEP=3 cm H20, and FiO2=0.4.

Demographic indicators of both research groups
Intraoperative monitoring data are presented in Table 2. Data from hemodynamic monitoring by the esCCO method and ventilation status of patients are shown in Table 3 at the start of the operation, 30 minutes after the start of the operation, 60 minutes after the start of the operation, at the end of the operation, and after 12 hours of MV postoperation. Driving pressure (ΔP), depending on Ppeak, was significantly lower in patients under the ASV regimen than in those under the PCV regimen (P<0.05). Respiratory volume was 7.4±1.2 ml/kg in group 1 and 6.2±0.8 ml/kg in group 2.

Duration of surgery and anesthesia, indicators of respiratory mechanics, infusion volume, and ventilation parameters
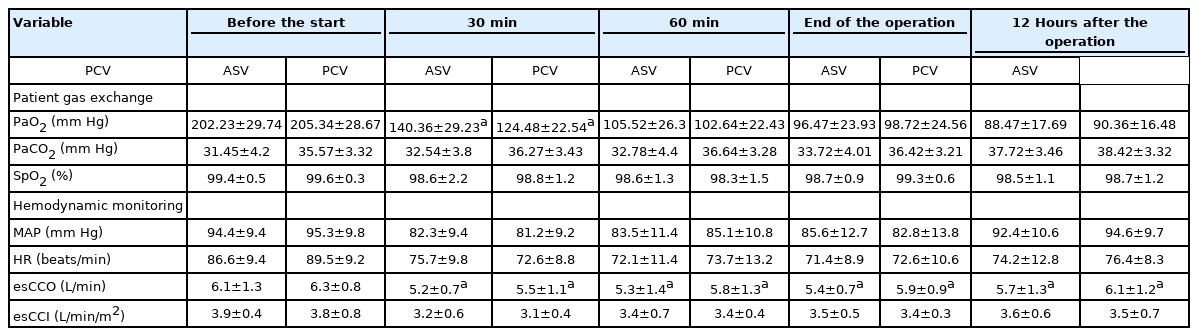
Data from hemodynamic monitoring by the esCCO method and ventilation status of patients
In order to enhance hemodynamic monitoring and to establish the relationships between the data of non-invasive monitoring by esCCO on ultrasound, the following indicators were determined. Before the operation, group 1 individuals had a CO of 6.1±1.3 L/min; the CO of the patients in group 2 was 6.3±0.8 L/min. The cardiac index (CI) of group 1 and group 2 patients was 3.9±0.4 L/min/m2 and 3.8±0.8 L/min/m2, respectively. The mean arterial pressure (MAP) values were 94.4±9.4 mm Hg and 95.3±9.8 mm Hg for group 1 and group 2 patients, respectively; the heart rate was 86.6±9.4 beats/min and 89.5±9.2 beats/min. The EF in group 1 was 55.4%±0.3%, and the value was 56.5%±0.5% in the second group. All indicators in both groups corresponded to the hyperdynamic type of blood circulation, likely due to the psycho-emotional experience of patients before surgery.
After 30 minutes from the start of surgery, group 1 patients experienced a decrease in hemodynamic parameters: CO decreased by 14.7% to 5.2±0.7 L/min, CI decreased by 17.9% to 3.2±0.6 L/min/m2, and MAP decreased by 12.8% to 82.3±9.4 mm Hg. Heart rate decreased by 12.6% to 75.7±9.8 beats/min. Echocardiography indicated that EF in patients of the first group decreased by 7.6%. Patients in the second group also recorded a slight decrease in the measured values relative to baseline at 30 minutes after the start of the surgery. CO decreased by 12.7% to 5.5±1.1 L/min., CI decreased by 18.4% to 3.1±0.4 L/min/m2, and EF decreased by 5.4% from baseline. MAP fluctuated within 14.8%, and its mean value was 81.2±9.2 mm Hg with a decrease in heart rate of 18.9% from baseline (72.6±8.8 beats/min).
One hour after the start of surgery, the mean CO values of patients in the second group were lower than baseline by 7.9% and differed from the dynamics of patients in the first group, in whom CO increased compared to the previous period but remained lower than baseline by 13.1%. At the end of the operation, the CO values were lower than baseline in patients of groups 1 and 2 by 11.5% and 6.3%, respectively. Twelve hours after surgery, the CO was lower than baseline by 6.6% and 3.1% in patients of the first and second groups, respectively; however, compared to the previous period, CO growth was 5.6% and 3.4%,. According to echocardiography, EF decreased in patients of the first group by 5.3% and patients of the second group by 1.6%.
The CO dynamics determined by the esCCO method during and after surgery in relation to the initial level of 100% are shown in Figure 2. The changes in EF during and after surgery in relation to the initial level of 100% are shown in Figure 3. The dynamics of CI in patients with surgical pathology were the same between groups at all stages of surgical treatment. This indicated an adequate level of fluid resuscitation of all patients. Evaluation of ultrasound data on the diameter of the inferior vena cava and the degree of its collapse confirmed these data (Table 4).
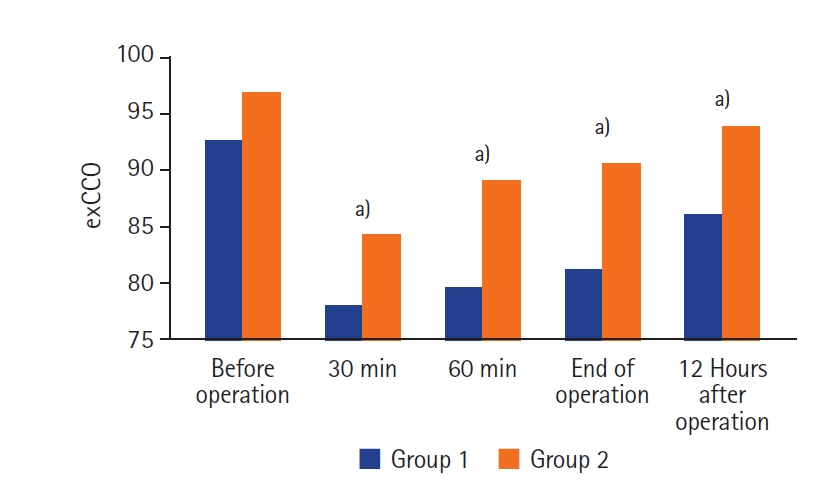
Cardiac output dynamics by estimated continuous cardiac output (esCCO) during surgery compared to baseline by non-invasive monitoring. Group 1: patients who received pressure-controlled ventilation ventilation; Group 2: patients who received adaptive support ventilation ventilation. a) P-value <0.05 compared with baseline level.
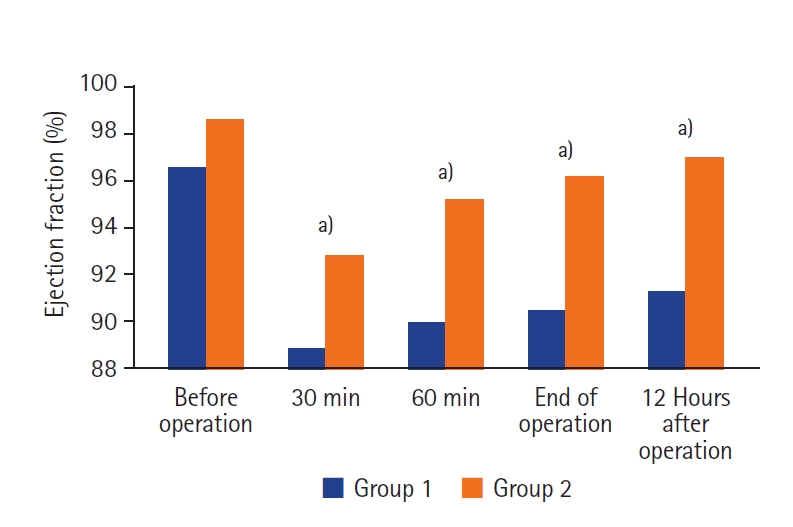
Dynamics of change of ejection fraction at all stages of research in comparison with the initial 100% level. Group 1: patients who received pressure-controlled ventilation ventilation; Group 2: patients who received adaptive support ventilation ventilation. a) P-value <0.05 compared with baseline level.
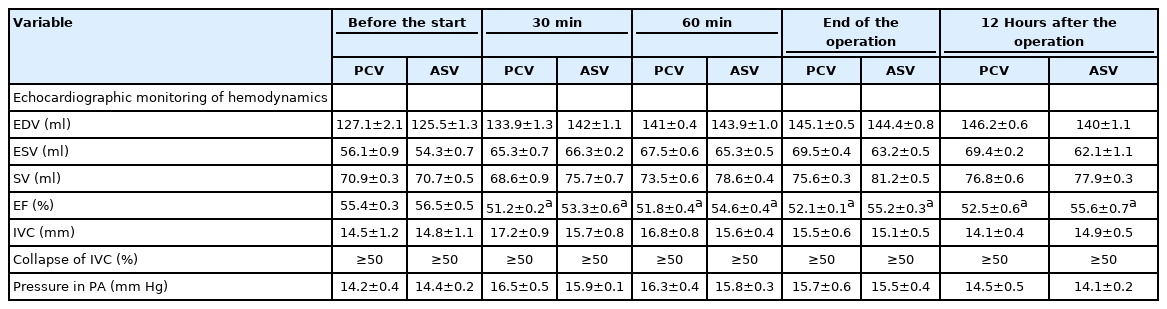
Hemodynamic data of ultrasound perioperative monitoring
The volume of infusion during the operation using balanced crystalloid solutions in group 1 patients was 1.9±0.6 L, and that in patients of group 2 was 1.8±0.4 L. Body weight was 27.8±1.3 kg for patients in group 1 and 25.1±1.6 kg for patients in group 2. SpO2 level was within normal limits throughout the observation period. The level of diuresis was adequate and exceeded 0.5 ml/hr. In continuous measurement of CO during surgery of group 2 patients, stable hemodynamic parameters were achieved, with a 9.7% decrease in infusion therapy compared with group 1.
The MANOVA results show that the chosen ventilation mode significantly affected both the ventilation parameters [VT, Ppeak, ΔP–F (3, 28)=20,507; P<0.0001; Wilk's Λ=0.313] and the hemodynamic parameters [esCCO, EF–F (2, 29)=853,996; P<0.0001; Wilk's Λ=0.017]. In addition, the parameters of hemodynamics (esCCO, EF) were significantly influenced by the ventilation parameters VT [F (50, 10)=6,830; P<0.001; Wilk's Λ=0.313], Ppeak [F (2, 9)=241,898; P<0.0001; Wilk's Λ=0.057], and ΔP [F (48, 12)=4.597; P<0.01; Wilk's Λ=0.003].
DISCUSSION
We conducted this study to research the features of intraoperative ventilation and to compare PCV and ASV regimens in surgical patients. We found that traditional PCV ventilation VT and hemodynamic monitoring results were different from the results using the ASV regimen. Ventilation should involve low VTs based on body weight index, moderately low PEEP, and the minimum possible FiO2 [1]. This ventilation tactic prevents postoperative pulmonary complications [8-11]. There is evidence that this approach improves postoperative respiratory function [11] and clinical results [8,10].
In our study, the SpO2 rate did not differ statistically between the two groups; however, PaO2 during surgery was higher in patients receiving the PCV regimen (Table 3). Hyperoxia causes systemic vasoconstriction and reduces microcirculation [12,13]. Those reduce CO and organ perfusion; as heart rate decreases, systemic vascular resistance increases and capillary permeability decreases [14]. Therefore, higher PaO2 level is not always associated with better oxygenation of tissues and organs.
According to the ARDSnet protocol, ventilation is considered protective if the VT is 4–8 ml/kg of ideal body weight, plateau pressure is <30 cm H2O, and ΔP is <15 cm H2O. In our study, VT was 16.2% lower and ΔP was 12.1% lower in the ASV group, depending on Ppeak level (P<0.05).
Based on patient data and respiratory mechanics (resistance, compliance, and autoPEEP), the safest ventilation parameters are automatically selected with the aim of target minute ventilation. Therefore, ASV can be used in patients with normal lungs and with restrictive or obstructive pulmonary pathology [15-18].
One of the additional benefits of ASV is early recognition of spontaneous breathing [19]. Studies show faster weaning times, fewer ASV manipulations, and fewer alarms than conventional ventilation modes [20]. In our study, with the same duration of surgery, the duration of anesthesia was shorter in patients of the second group, which may have been due to better synchronization of the device with the patient. At 60 minutes after the beginning and at the end of the operation, a more pronounced decrease in CO was observed in patients of the first group compared to baseline (Table 3). Analyzing the CO values at the end of the operation and 12 hours after the operation, the CO almost doubled in patients of the first group compared to the group in which the ASV mode was used.
As in Figures 2 and 3, the same dynamics of change and correlation of CO indicators determined by the esCCO method and ultrasonic EF parameters were observed between groups. Heart rate and CI did not differ significantly between the two groups, which indicates a more pronounced negative hemodynamic effect of PCV during perioperative ventilation. Perioperative ventilation should be protective and hemodynamically safe. In our study, perioperative ASV mode ventilation was characterized by lower VT (16.2%) and ΔP (12.1%) than PCV.
Modern technologies for determining cardiac output (esCCO) allow non-invasive continuous perioperative monitoring and optimize hemodynamic parameters, helping in clinical decision-making. In the group of patients in whom the ASV regimen was used, fewer hemodynamic effects were observed during MV compared to patients in whom PCV ventilation was used. Hemodynamic esCCO monitoring data correlated with ultrasound parameters, indicating high informativeness and reliability of non-invasive monitoring. Hemodynamically-controlled MV avoids over-administration of vasoactive drugs and excessive infusion therapy, reducing the negative impact of cardiopulmonary interactions during MV.
KEY MESSAGES
▪ Most patients require mechanical ventilation during surgery, and there is currently no clear evidence of the benefits of any ventilation mode.
▪ The aim of our study was to evaluate the hemodynamic protective effects of pressure-controlled ventilation (PCV) and adaptive support ventilation (ASV) mode perioperative ventilation based on indicators of non-invasive hemodynamic monitoring.
▪ In our study, ASV mode perioperative ventilation was more protective than PCV mode.
Notes
CONFLICT OF INTEREST
No potential conflict of interest relevant to this article was reported.
FUNDING
None.
ACKNOWLEDGMENTS
We would like to thank the A. Getlik Clinic for Children and Adolescents, Slovak Medical University and University Hospital of Medicine in Bratislava, Slovakia for administrative support and assistance.
AUTHOR CONTRIBUTIONS
Conceptualization: DD, DO. Data curation: all authors. Formal analysis: DD, DO. Methodology: DD, DO. Project administration: DO. Visualization: DD, MM, NO. Writing-original draft: DD, DO. Writing–review & editing: DO, DD.