The frequency and seasonal distribution of viral infection in patients with community-acquired pneumonia and its impact on the prognosis
Article information

Abstract
Background
Studies on the effects of viral coinfection on bacterial pneumonia are still scarce in South Korea. This study investigates the frequency and seasonal distribution of virus infection and its impact on the prognosis in patients with community-acquired pneumonia (CAP).
Methods
The medical records of CAP patients with definite etiology, such as viruses and bacteria, were retrospectively reviewed. Their epidemiologic and clinical characteristics, microbiologic test results, the severity of illness, and 30-day mortality were analyzed.
Results
Among 150 study subjects, 68 patients (45.3%) had viral infection alone, 47 (31.3%) had bacterial infection alone, and 35 (23.3%) had viral-bacterial coinfection, respectively. Among 103 patients with viral infections, Influenza A virus (44%) was the most common virus, followed by rhinovirus (19%), influenza B (13%), and adenovirus (6%). The confusion-urea-respiratory rate-blood pressure-age of 65 (CURB-65) score of the viral-bacterial coinfection was higher than that of the viral infection (median [interquartile range]: 2.0 [1.0–4.0] vs. 2.0 [0.3–3.0], P=0.029). The 30-day mortality of the viral infection alone group (2.9%) was significantly lower than that of bacterial infection alone (19.1%) and viral-bacterial coinfection (25.7%) groups (Bonferroni-corrected P<0.05). Viral-bacterial coinfection was the stronger predictor of 30-day mortality in CAP (odds ratio [OR], 18.9; 95% confidence interval [CI], 3.0–118.3; P=0.002) than bacterial infection alone (OR, 6.3; 95% CI, 1.1–36.4; P=0.041), compared to viral infection alone on the multivariate analysis.
Conclusions
The etiology of viral infection in CAP is different according to regional characteristics. Viral-bacterial coinfection showed a worse prognosis than bacterial infection alone in patients with CAP.
INTRODUCTION
Pneumonia is an infectious disease that affects lung parenchyma, resulting in the hosts' inflammatory reaction to microorganisms, and it ranks the first among the causes of death in patients with infectious diseases over 65, with 12%–40% mortality rates based on whether they admit the intensive care unit (ICU) [1]. According to statistics on the cause of death in Korea, even if deaths from pneumonia were only 9.4 per 100,000 population in 2007, they increased to 45.4 per 100,000 population in 2018, and pneumonia was the third most common cause of death in that report [2,3].
Community-acquired pneumonia (CAP) is typically caused by bacteria, such as Streptococcus pneumoniae, Hemophilus influenzae, Staphylococcus aureus, and Gram-negative bacilli. However, with the development of molecular biological diagnostic technology, multiplex reverse transcriptase polymerase chain reaction (RT-PCR) tests for virus detection have been increasingly used at treatment sites, and respiratory viruses have been reported in 20%–40% of CAP cases [4]. Respiratory viruses can be causes of pneumonia by themselves, or they can be a leading factor for progressing to bacterial pneumonia or coinfection with bacteria [5]. Although a study reported that pneumonia caused by viral-bacterial coinfection was associated with a robust inflammatory response and severer clinical course than those caused by either viral or bacterial infection [6], the knowledge of the impact of viral-bacterial coinfections on treatment outcomes in CAP is still scarce. This study attempted to evaluate the frequency of viral infection in CAP, monthly and seasonal epidemiology of respiratory virus infections, and the impact of viral-bacterial coinfection on treatment outcomes in CAP patients.
MATERIALS AND METHODS
This study protocol was approved by the Institutional Review Board of Dankook University Hospital (No. 2020-09-026). The requirement to obtain informed consent was waived because of the retrospective nature of the study design.
Data Collection
This study was conducted retrospectively in adult patients aged 19 years or older admitted to Dankook University Hospital, a tertiary teaching hospital in the central province of South Korea, from January 1, 2016, to December 31, 2018, to treat CAP as the primary disease. We included patients with pneumonia confirmed by chest X-ray or chest computed tomography (CT) and microbial tests performed within 72 hours after hospitalization for respiratory secretion, including sputum, bronchial aspirates, and bronchoalveolar lavage for both respiratory virus RT-PCR and bacterial cultures. Patients were excluded if hospitalized within 28 days for immunocompetent patients and within 90 days for immunocompromised patients. Immunocompromised patients were defined as those who received a solid organ or hematopoietic stem cell transplantation, ongoing chemotherapy, and steroid (prednisone equivalent to ≥20 mg/day) or other immunosuppressive treatment for more than 28 days. In addition, patients with risk factors for non-community acquired respiratory pathogens, such as those with a tracheostomy or a percutaneous endoscopic gastrostomy tube, those transferred from long-term care facilities, those transferred from other hospitals after more than 5 days of hospitalization for current treatments, and patients whose treatment outcomes were not defined, such as those transferred out to other hospitals without improvement were also excluded.
Medical records and radiographs of the study population were reviewed. To compare clinical characteristics of subjects, age, sex, smoking history, comorbidities including diabetes, chronic heart disease, chronic liver disease, chronic respiratory disease, and chronic kidney disease, the confusion-urea-respiratory rate-blood pressure-age of 65 (CURB-65) score and its components to evaluate the initial severity of pneumonia before hospitalization, blood test results representing infection states, such as complete blood cell count, neutrophil percentages (%) of white blood cell (WBC) differential counts, C-reactive protein (CRP) and procalcitonin, the Sequential Organ Failure Assessment (SOFA) score and its components, the results of respiratory virus RT-PCR and bacterial cultures including respiratory secretion, blood, and pleural effusion, Mycoplasma immunoglobulin M (IgM) antibodies, S. pneumoniae urinary antigens, Legionella urinary antigens, the frequency of ICU admission and the length of ICU stay, the total length of hospitalization, and treatment outcomes, including discharge after recovery, death during hospitalization, and 30-day mortality were analyzed. Chest X-rays and CTs were investigated to define the radiographic severity of pneumonia. A simple chest X-ray divided the left and right lungs into the upper and lower parts. The number of areas with pneumonic consolidation on an initial chest X-ray, the presence of bilateral pneumonia, and parapneumonic pleural effusion were evaluated.
Statistical Analysis
All results are presented as numbers with percentages for categorical variables and medians with interquartile ranges for continuous variables. The Mann-Whitney U-test or Kruskal-Wallis test was used to compare continuous variables, and the chi-square test or Fisher’s exact test was used to compare categorical variables. Bonferroni correction was additionally performed if comparisons were multiple. Univariate and multivariate binary logistic regression analyses using the backward elimination procedure were done to evaluate predictors for 30-day mortality. Variables included in multivariate analysis were selected from univariate analyses presenting solid statistical significance or clinically essential variables. IBM SPSS version 28.0 (IBM Corp., Armonk, NY, USA), was used for all analyses, and P-value <0.05 indicated statistical significance.
RESULTS
General Characteristics of Subjects
A total of 267 patients conducted both respiratory virus RT-PCR and microbial tests for respiratory secretion during the study period. Among them, 150 patients with known causative microorganisms of pneumonia and definite treatment outcomes were analyzed (Table 1). They were classified into viral infection alone (group A), bacterial infection alone (group B), and viral-bacterial coinfection (group C) groups (Figure 1). The median age of all patients was 73.0 years (60.0–81.3), and 62.7% were male. Twenty-five patients (16.7%) were current smokers. Chronic lung disease was the most common comorbidity (27.3%), followed by diabetes (20.7%), chronic heart disease (14.7%), chronic kidney disease (5.3%), and chronic liver disease (0.7%). There were no statistical differences among groups for age, sex, smoking history, and comorbidities (P>0.05 for all).
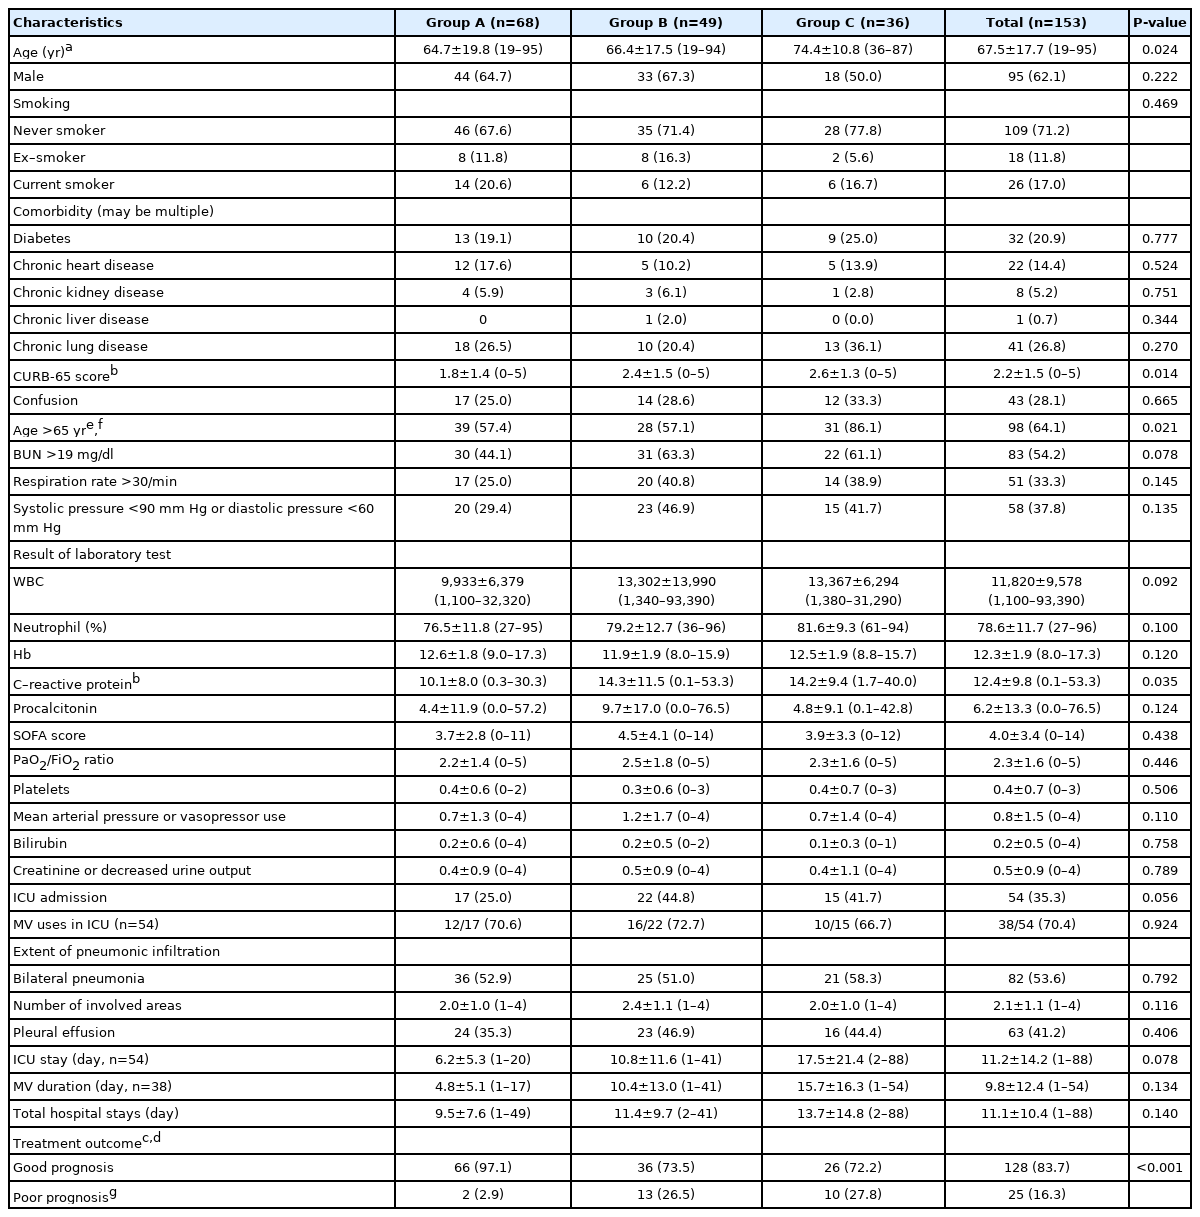
Characteristics of 150 patients with pathogen confirmed community-acquired pneumonia

Flowchart of patient enrollment. CAP: community–acquired pneumonia; RT–PCR: reverse transcriptase polymerase chain reaction.
The median CURB-65 score was 2.0 (1.0–3.0) points in total, and group C had statistically higher CURB-65 scores than group A (2.0 [1.0–4.0] vs. 2.0 [0.3–3.0], P=0.029). Analyses of each component of the CURB-65 score showed a higher frequency of age over 65 years in group C (85.7%) than in group A (57.4%) and B (59.6%) (Bonferroni-corrected P<0.05). While the percentage of neutrophil, hemoglobin, CRP, and procalcitonin levels were not different among groups, the median WBC count was significantly higher in group C than in group A (10,860 [8,580–17,710] vs. 8,815 [5,120–13,220], P=0.019). The SOFA score was calculated for all patients regardless of admission to the ICU. The median SOFA score was 3.0 (1.0–5.0) points, and there was no significant difference in the scores among groups (group A: 3.0 [1.3–5.0] vs. group B: 3.0 [1.0–8.0] vs. group C: 3.0 [1.0–5.0], P=0.909).
The total number of ICU admission cases was 52 (34.7%), and group B and C showed a more frequent tendency of ICU admission than group A (group B: 44.7% and group C: 40.0% vs. group A: 25.0%, P=0.070). Even if mechanical ventilation (MV) was applied for 36 of 52 (69.2%) of the ICU admission cases, there was no significant difference among groups (group A: 70.6% vs. group B: 71.4% vs. group C: 64.3%, P=0.894). Additionally, the length of hospitalization (group A: 8.0 [5.0–11.0] vs. group B: 8.0 [4.0–17.0] vs. group C: 9.0 [6.0–18.0], P=0.268), the length of ICU stays (4.0 [3.0–7.0] vs. 6.0 [3.5–12.5] vs. 14.0 [3.0–22.8], P=0.225), and the duration of MV (2.5 [1.0–8.0] vs. 4.0 [3.0–12.0] vs. 8.0 [5.0–21.0], P=0.092) were not different among groups.
In the issues of radiographic severities, bilateral pneumonia was observed in 80 (53.3%), and the median number of areas with consolidation was 2.0 (1.0–3.0). Pleural effusion was accompanied in 60 patients (40.0%). There were no significant differences among groups for all items examined in radiographs (P>0.05 for all). The number of patients discharged from the hospital after improvement was 128 (85.3%). Group A patients of 97.1% were discharged from the hospital after improvement. However, the percentages of patients who died within 30 days of hospitalization in group B and group C were significantly higher than in group A (group B: 9 [19.1%] and group C: 9 [25.7%] vs. group A: 2 [2.9%], Bonferroni-corrected P<0.05).
Causative Microorganisms of Pneumonia
The frequency of viruses detected by the respiratory virus RT-PCR test was presented in Figure 2. The most frequently detected viruses were influenza A virus, accounting for 44% of the total, followed by rhinovirus (19%), influenza B (13%), adenovirus (6%), metapneumovirus (5%), and parainfluenza virus (5%). In the case of coronavirus, NL63 (2%), and OC43 (3%) were confirmed.
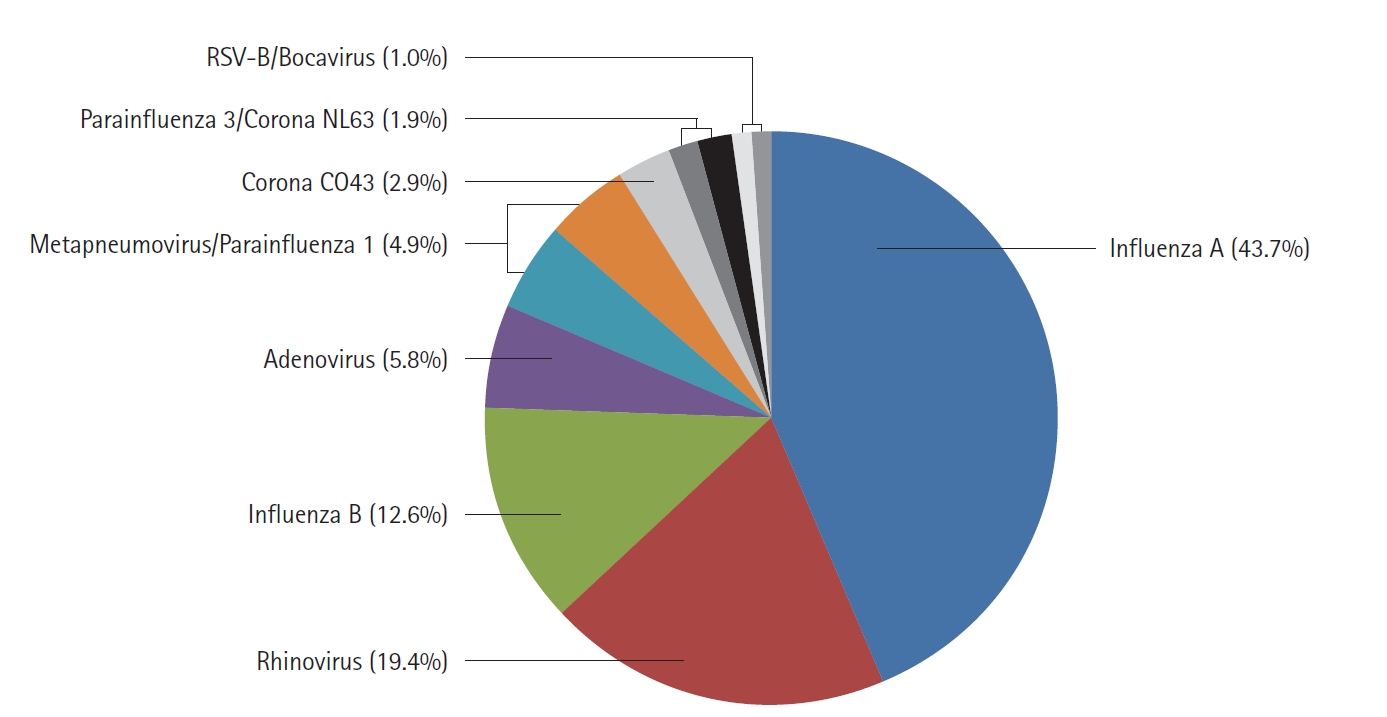
The frequency of causative respiratory viruses detected by reverse transcriptase polymerase chain reaction tests. Values are presented as the percentage of viruses detected from patients. RSV: respiratory syncytial virus.
The monthly distribution of respiratory viruses detected in at least 5% was presented in Figure 3. Influenza A and B viruses increased from December, with the highest frequency in February, and then decreased, showing a briefly increased detection in July and August. Rhinovirus had the highest frequency during the change of seasons from May to June and from September to October. In the cases of other viruses, the detection frequency was very low throughout the year. Overall, viruses were rarely detected in the midsummer season, between July and August.
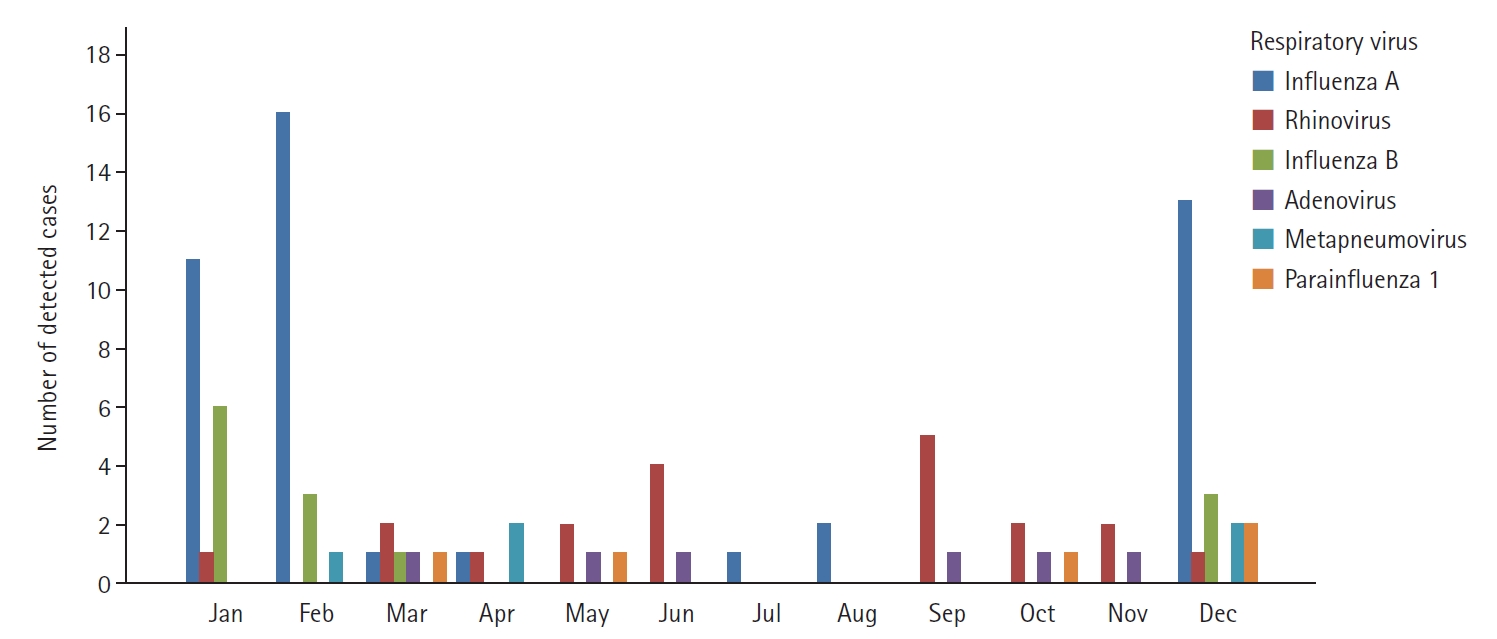
The monthly distribution of the six most common respiratory viruses accounts for more than 5%. Values are presented as the number of detected cases.
The frequency of bacterial strains defined by bacterial cultures, urinary antigen tests, and IgM antibodies was presented in Figure 4. The most frequent bacteria were Klebsiella pneumoniae, which was detected in 22 of 150 patients (14.7%). S. pneumoniae, previously known as the most common causative organism of pneumonia, was detected in 19 patients (12.7%), followed by Pseudomonas aeruginosa (5.3%), Mycoplasma pneumoniae (5.3%), H. influenzae (4.0%), Escherichia coli (3.3%), and methicillin-resistant S. aureus (3.3%).

The frequency of causative bacteria from bacterial cultures, urinary antigen tests, and immunoglobulin M antibodies. Values are presented as the number of isolated cases. MRSA: methicillin-resistant Staphylococcus aureus; MSSA: Methicillin–susceptible Staphylococcus aureus.
Clinical Characteristics Based on 30-Day Mortality
The difference in clinical characteristics based on 30-day mortality was analyzed (Table 2). There were no significant differences in age, sex, smoking history, and comorbid diseases between the two groups (P>0.05 for all). The median CURB-65 score was significantly lower in the survivor group than in the non-survivor group (2.0 [1.0–3.0] vs. 4.0 [2.3–4.0], P<0.001). Among the components of the CURB-65 score, the frequencies of patients with confusion (23.8% vs. 50.0%), high respiration rates (26.9% vs. 65.0%) and hypotension (30.0% vs. 85.0%) were significantly lower in the survivor group (P<0.05 for all). Among the laboratory test variables, the median procalcitonin value was significantly lower in the survivor group (0.4 [0.1–3.9] vs. 2.7 [0.2–23.4], P=0.049).

Clinical characteristics based on 30-day mortality
The median SOFA score was also lower in the survivor group than in the non-survivor group (3.0 [1.0–5.0] vs. 8.0 [4.0–11.0], P<0.001). Among the components of the SOFA score, the scores of the PaO2/FiO2 ratio (2.0 [1.0–3.0] vs. 3.0 [4.0–5.5], P<0.001), mean arterial pressure or vasopressor use (0.0 [0.0–1.0] vs. 4.0 [0.0–4.0], P<0.001) and creatinine or decreased urine output (0.0 [0.0–0.0] vs. 0.0 [0.0–1.8], P=0.049) were significantly lower in the survivor group than in the non-survivor group. In addition, the cases of ICU admission (26.9% vs. 85.0%, P<0.001), MV treatment (60.0% vs. 88.2%, P=0.039), and with bilateral pneumonia (50.0% vs. 75.0%, 0.037) were more common in the non-survivor group. Comparing the differences in prognosis according to the types of infection, while only 2.9% of group A patients died from CAP during hospitalization, 19.1% in group B and 25.7% in group C died, respectively. (Bonferroni-corrected P<0.005 for each).
Predictors for Poor Prognosis in Patients with CAP
Univariate and multivariate binary logistic regression analyses were performed to evaluate predictors for 30-day mortality (Table 3). In the univariate analysis, the CURB-65 score had an odds ratio (OR) of 2.1 (95% confidence interval [CI], 1.4–3.2; P<0.001). Procalcitonin was weaker but showed a statistically significant OR of 1.0 (95% CI, 1.0–1.1; P=0.015). In the case of the SOFA score, OR was 1.5 (95% CI, 1.2–1.7; P<0.001). According to the types of infection, group C and B were stronger predictors associated with 30-day mortality compared to group A, with OR of 11.4 (95% CI, 2.3–56.5; P=0.003) and OR of 7.8 (95% CI, 1.6–38.1; P=0.011), respectively. Among all variables, admission to the ICU and MV treatment were the most potent predictors affecting 30-day mortality with, OR of 15.4 (95% CI, 4.3–55.7; P<0.001), and OR of 15.6 (95% CI, 5.1–47.5; P<0.001), respectively.
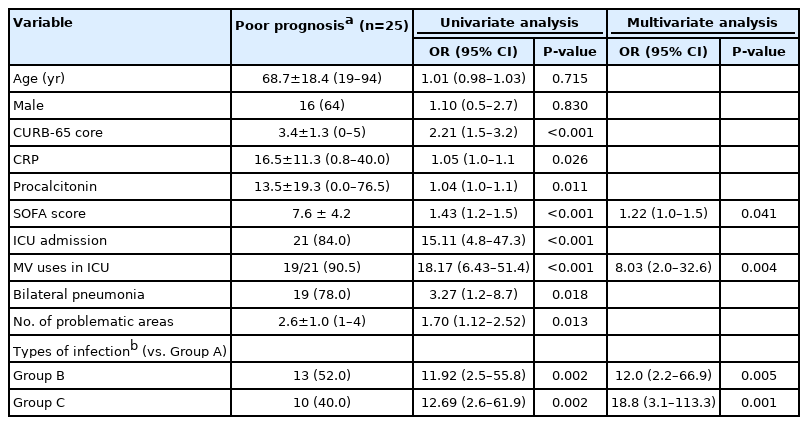
Predictors of 30-day mortality on community-acquired pneumonia
Among the factors obtained from the univariate analysis, age, male sex, CURB-65, SOFA scores, MV treatment, bilateral pneumonia, and infection types were selected for multivariate analysis. Eventually, compared to group A, group C (OR, 18.9; 95% CI, 3.0–118.3; P=0.002) and B (OR, 6.3; 95% CI, 1.1–36.4; P=0.041) were independently associated with worse 30-day mortality in CAP. MV use (OR, 5.5; 95% CI, 1.2–24.9; P=0.027) and the higher SOFA score (OR, 1.3; 95% CI, 1.1–1.6; P=0.013) were also associated with poor outcomes.
DISCUSSION
This study was conducted on patients hospitalized for CAP treatment in a medium-sized city in rural areas. We evaluated the frequency of viral infection in patients with CAP, the monthly distribution of common respiratory viruses, and the impact of viral coinfection on CAP treatment outcomes. In this study, influenza A and B viruses and rhinovirus were the most common viruses associated with CAP. Elderly patients over 65 years had more frequent viral-bacterial coinfection than younger patients. Compared to viral infection alone, viral-bacterial coinfection was a stronger predictor for 30-day mortality than bacterial infection alone in CAP treatment.
Viral pneumonia was rarely investigated in sparsely populated local cities and rural areas in South Korea. Because most respiratory virus infections are transmitted through human-to-human contact transmission under densely populated environment, we hypothesized there might be differences in the epidemiological and clinical presentation of respiratory virus infections between major cities and more remote areas. This study provides epidemiological information on virus infection in the rural community compared to existing studies on metropolitans. Among 267 CAP patients who conducted both respiratory virus RT-PCR and microbial tests for respiratory secretion during the study period, 103 (39%) were defined to have viral infections and was higher than the total number of patients with the bacterial infection including those with virus coinfection (n=82, 31%). This result shows that viral infection in CAP would be more frequent than expected. A survey of 456 patients with CAP in Korea reported that 60 of 327 (18.3%) were detected with respiratory virus infection [7]. In another study of 198 patients with severe CAP admitted to the ICU in Seoul, the capital of South Korea, more than one respiratory virus was detected in 36.4% of patients [8]. Seoul is a megalopolis of about 9.5 million people and is famous for its overpopulation. Therefore, it is different from our expectation that the virus infection rates in areas where contact transmission is predicted to be small are higher than in larger cities.
In this study, influenza A virus accounted for 44% of all viruses, followed by rhinovirus (19%), influenza B (13%), adenovirus (6%), coronavirus including NL63 and OC43 (5%), metapneumovirus (5%), and parainfluenza virus 1 (5%). Kang et al. [7] reported that the influenza virus (38%) was the most common, and respiratory syncytial virus (RSV; 15%), rhinovirus (12%), coronavirus (10%), adenovirus (10%), metapneumovirus (8%), and parainfluenza virus (5%) were detected in order. In the study of the ICU patients with severe CAP, the frequency of virus varied with rhinovirus (23.6%), parainfluenza (20.8%), metapneumovirus (18.1%), influenza virus (16.7%), RSV (13.9%), coronavirus (5.6%), and adenovirus (1.4%) [8]. In addition, a study of 2,488 adults conducted in the United States showed national differences in frequent viruses in the order of rhinovirus (9%), influenza A and B (6%), metapneumovirus (4%), and RSV (3%) [9]. These findings suggest that epidemiological characteristics of CAP’s respiratory virus infection would differ depending on the regionality and pneumonia severity.
The most common causative bacteria were K. pneumoniae detected in 14.4% of patients. S. pneumoniae as the most common cause of pneumonia was reported in 27%–69% previously [10,11], but was relatively less frequent (12.7%) in this study. Compared to foreign countries, domestic reports have a relatively high frequency of identifying K. pneumoniae and P. aeruginosa. Most of the studies in Korea were conducted at tertiary hospitals, interpreting that many severely ill patients were included [12]. In this study, the number of patients admitted to the ICU was 52 of 150 (34.7%), and severer patients were included much more in the study population. Given the pattern of bacterial identification, it should be considered to use wide-spectrum antibiotics to cover most gram-negative bacteria for patients needing inpatient CAP treatment at this area.
In the evaluation of pneumonia severity at the time of hospitalization, the CURB-65 scores of group C were significantly higher than that of group A. The higher CURB-65 score in group C is due to a significantly higher proportion of elderly patients aged over 65 (85.7%) than those in group A (57.4%) and B (59.6%). Because other CURB-65 components were not different among groups, it seems that the old age ≥ of 65 is a more important contributor to the initial severity of CAP in this study. Considering the 30-day mortality rate was highest in group C (25.7%) than in group A (2.9%) and B (19.1%), and group C was the strongest predictor of 30-day mortality in a multivariate analysis than group B, old age may be a leading factor for viral-bacterial coinfection and determining the severity of CAP, and the combination of old age and viral coinfection is thought to make CAP patients’ prognosis worse.
Several studies have shown why the elderly population is vulnerable to virus infection. Impairment of Toll-like receptor function in alveolar macrophages is associated with severe lung damage, and difficulties in transitions between pro-inflammatory and anti-inflammatory states and prolonged active macrophages are suggested as the causative mechanisms of severe lung injury [13-15]. In addition, atrophy of the thymus with aging, resulting in a decrease in the production of naive T cells, accumulation or exhaustion of memory B cells, exhaustion of cytotoxic T and helper T cells, and impaired T cell receptor expansion have also been suggested as causes of increased vulnerability and progression to severe diseases [16-18]. Given these past reports, the increasing tendency of virus-bacterial coinfections in elderly patients and their worse outcomes might be partly due to inadequate virus clearance and an increased tendency to secondary bacterial infection.
The limitation of this study are as follows: firstly, because of the small sample size, our study has a limit on generalizing the results. We had to analyze CAP patients with definite etiology, including bacteria and viruses, and thus 114 patients initially enrolled were excluded. In addition, the sample size became much smaller after 150 patients were categorized into three groups. For this reason, well-validated prognostic factors for pneumonia, such as age, sex, and CURB-65 score, were not significant predictors in the multivariate analysis. Therefore, further study on a larger scale should be needed to validate our results. Secondly, most respiratory virus RT-PCR tests and bacterial cultures were performed on sputum samples, resulting in low sensitivity, specificity, and accuracy to reflect lower airway infections. Thus, specimens should be obtained by bronchoscopic sampling to reflect true viral pathogens. Thirdly, because this study did not investigate antibiotic-resistant patterns and appropriate antibiotic use, the effects of appropriate antibiotic use on the prognosis were not evaluated. Lastly, the mechanism of the increase in viral and bacterial coinfection with aging was not revealed because blood tests for various cytokines and interferons were not evaluated due to the limitation of the retrospective study. However, despite these limitations, this study presented the epidemiologic characteristics of viral infection on CAP in the rural province of Korea, showing different findings from previous metropolitan-based studies. This study also implicates the potential for worse prognosis in elderly patients with viral-bacterial coinfected CAP and the need for a large-scale prospective study.
KEY MESSAGES
▪ The most frequently detected viruses were influenza A virus (44%), followed by rhinovirus (19%), influenza B (13%), and adenovirus (6%) in community-acquired pneumonia (CAP) patients.
▪ Viral-bacterial coinfection was significantly more frequent in elderly patients over 65 than both viral alone and bacterial alone infection.
▪ Compared with viral alone infection, viral-bacterial coinfection was the stronger predictor of 30-day mortality in CAP than bacterial alone infection.
Notes
CONFLICT OF INTEREST
No potential conflict of interest relevant to this article was reported.
FUNDING
None.
ACKNOWLEDGMENTS
None.
AUTHOR CONTRIBUTIONS
Conceptualization: DHK. Data curation: KJK. Formal analysis: all authors. Methodology: DHK. Project administration: DHK. Visualization: KJK. Writing–original draft: all authors. Writing–review & editing: all authors.