Real-time distinct visualization of barotrauma risk monitored by electrical impedance tomography in a COVID-19 and latent tuberculosis case
Article information

A 50-year-old man tested positive for coronavirus disease 2019 (COVID-19) with a medical history of a 3-year-old untreated pulmonary tuberculosis required mechanical ventilation (inspiratory pressure of 15 cm H2O) and electrical impedance tomography (EIT) monitoring. His chest radiograph shows cavitation present in the upper right lobe, which is one of the features of post-primary tuberculosis infection, and a COVID-19 coinfection may facilitate the risk for barotrauma due to its inhomogeneous parenchyma the additional maldistribution of mechanical-ventilator stress (Figure 1) [1-3]. EIT showed a heterogeneous lung volume between anterior-right (cavitation side) and anterior-left (control side) lobes among three positive end-expiratory pressure (PEEP) levels (Figure 1). The EIT functional image shows (1) a progressive lung volume reduction as end-expiratory lung volume increases leading to a greater compression of gas and a resulting potential overdistension, and (2) an ascending volume difference between both half lobes (the blue and red waveforms are overlapped at the lowest PEEP level, and their gap widens as the end-expiratory lung volume increases). There is a lower recruitment/overdistension ratio for the anterior-right at the last PEEP level and this ratio difference increases by PEEP change. The elastic component may be limited by the cavitation and a local stretch exacerbated by the PEEP change presenting a high risk of barotrauma.
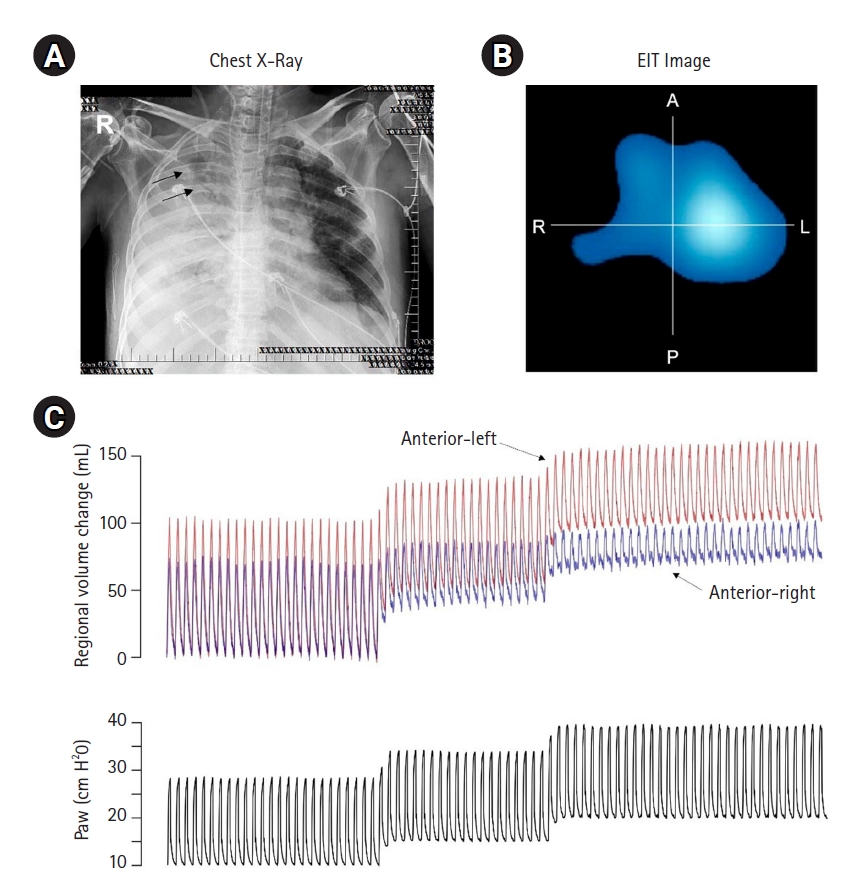
(A) Chest X-ray shows the cavitation sign at the anterior-right region. (B) Electrical impedance tomography (EIT) functional image shows the ventilation distribution in four regions (right [R], left [L], anterior [A], and posterior [P]). (C) Waveforms plot of lung volume for anterior-left (red) and anterior-right (blue) regions and airway pressure (inspiratory pressure 15 cm H2O plus positive end-expiratory pressure of 10 cm H2O, 15 cm H2O, and 20 cm H2O).
Notes
CONFLICT OF INTEREST
No potential conflict of interest relevant to this article was reported.
FUNDING
None.
ACKNOWLEDGMENTS
Funding for this project was provided by Universidade Federal de Pernambuco/PROPESQI/PROPG, CAPES CODE 001, CNPq (GRANT 403341/2020-5 and 421756/2021-7) and FACEPE (APQ-0249-4.08/20 and APQ 0801-4.08/21).
AUTHOR CONTRIBUTIONS
Conceptualization: CCAM, SLC. Data curation: WSL. Formal analysis: WSL. Funding acquisition: SLC, DCB, ADA. Methodology: CCAM, WSL. Project administration: SLC, DCB, ADA. Visualization: CCAM, WSL. Writing–original draft: WSL. Writing–review & editing: all authors.