Development of a deep learning model for predicting critical events in a pediatric intensive care unit
Article information
Abstract
Background:
Identifying critically ill patients at risk of cardiac arrest is important because it offers the opportunity for early intervention and increased survival. The aim of this study was to develop a deep learning model to predict critical events, such as cardiopulmonary resuscitation or mortality.
Methods:
This retrospective observational study was conducted at a tertiary university hospital. All patients younger than 18 years who were admitted to the pediatric intensive care unit from January 2010 to May 2023 were included. The main outcome was prediction performance of the deep learning model at forecasting critical events. Long short-term memory was used as a deep learning algorithm. The five-fold cross validation method was employed for model learning and testing.
Results:
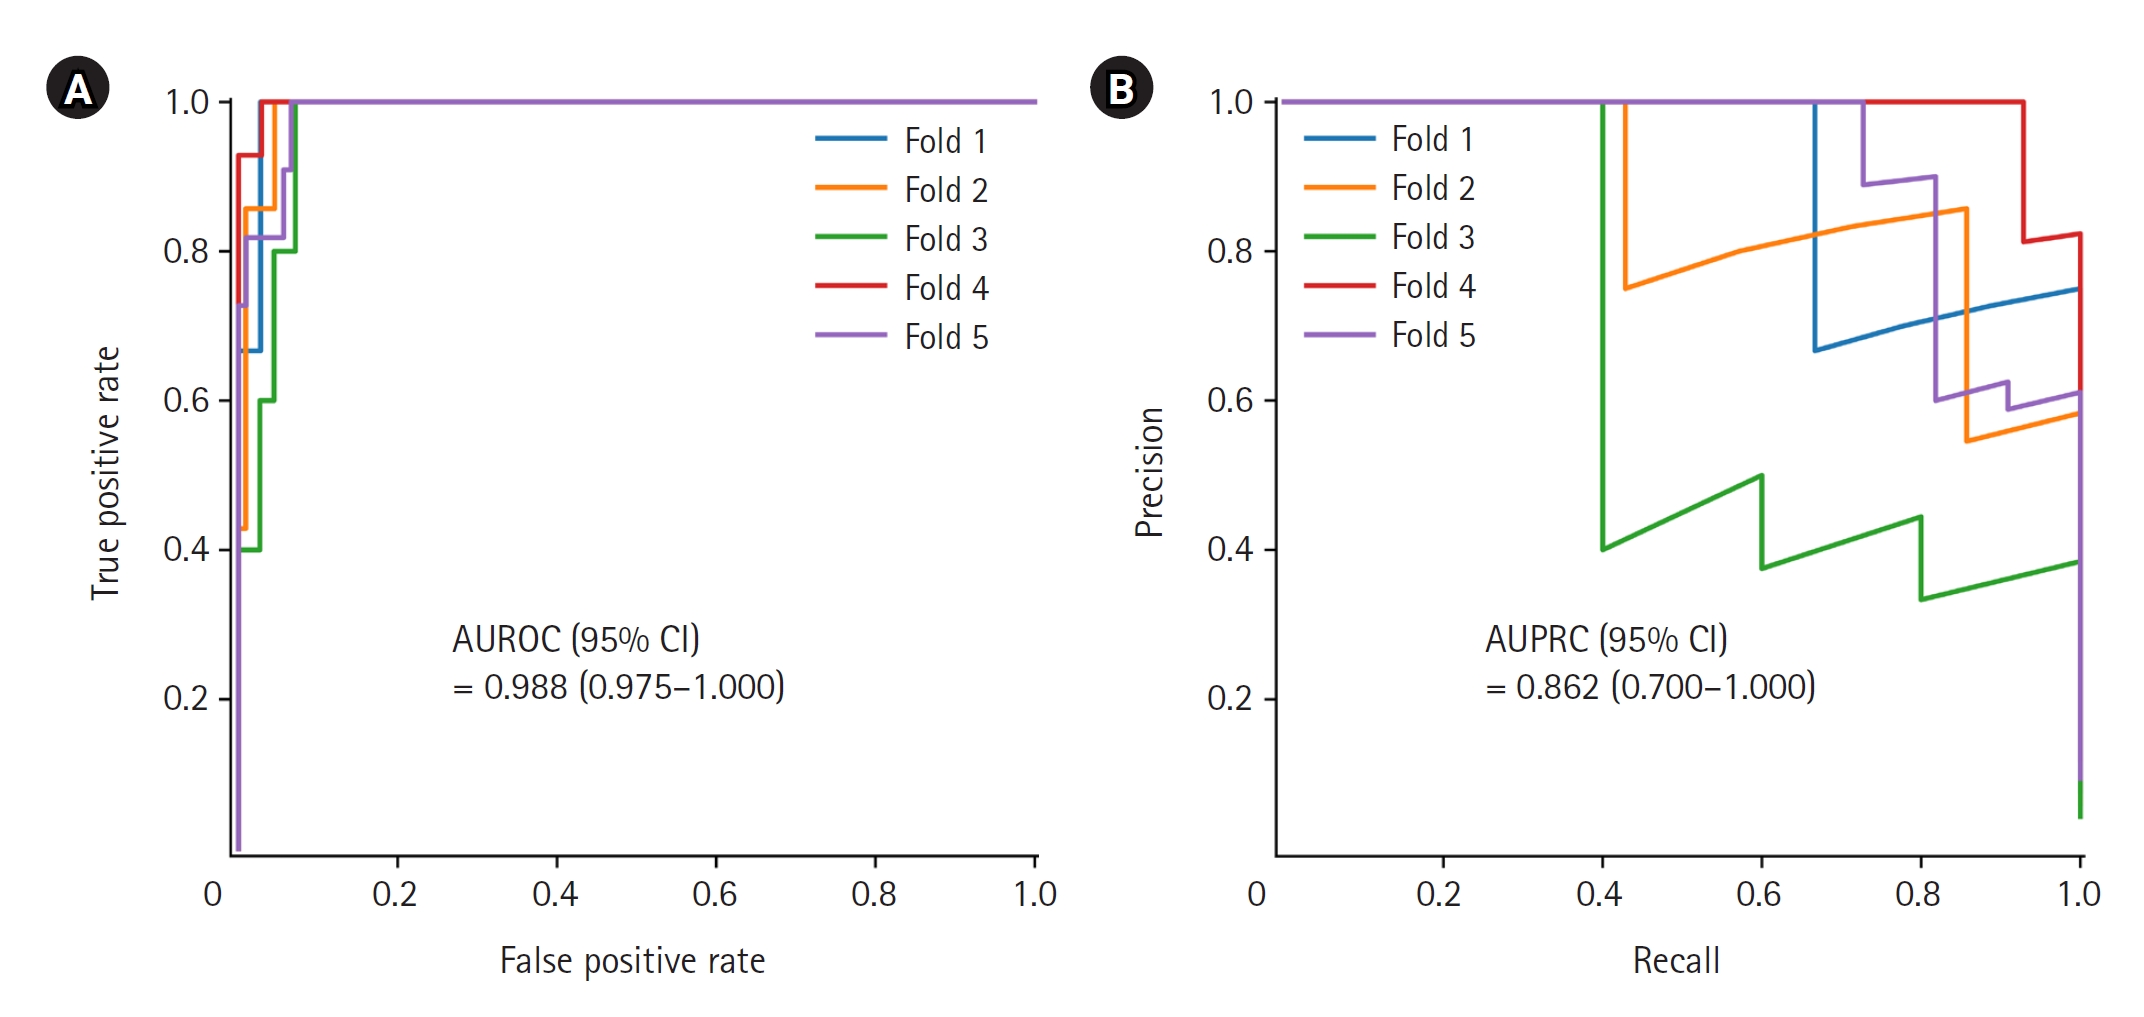
Among the vital sign measurements collected during the study period, 11,660 measurements were used to develop the model after preprocessing; 1,060 of these data points were measurements that corresponded to critical events. The prediction performance of the model was the area under the receiver operating characteristic curve (95% confidence interval) of 0.988 (0.975–1.000), and the area under the precision-recall curve was 0.862 (0.700–1.000).
Conclusions:
The performance of the developed model at predicting critical events was excellent. However, follow-up research is needed for external validation.
INTRODUCTION
Effective prediction and early identification of critical events in pediatric patients within the intensive care setting is a vital aspect of improving patient outcomes. Critical events encompass a range of significant and potentially life-threatening occurrences that require immediate intervention, such as cardiopulmonary resuscitation (CPR) [1], while cardiac arrest specifically refers to cessation of cardiac activity. Both critical events and cardiac arrests pose substantial challenges and carry high risks among children in intensive care units (ICUs) [2,3]. Timely recognition and intervention during these critical events are crucial for enhancing patient survival and minimizing long-term morbidity [4,5].
However, accurately predicting critical events in children is challenging due to variations in vital signs according to age. Existing clinical scoring tools, including the Pediatric Risk of Mortality III (PRISM-III) [6] and the Pediatric Index of Mortality 3 (PIM3) [7], offer severity assessments of pediatric patients primarily at the time of admission. While these clinical scores are effective at estimating severity upon admission, it is also crucial to accurately predict severity during hospitalization. Machine learning models have emerged as valuable tools for this purpose and effectively capture vital sign changes throughout the course of ICU stays. Machine learning, a branch of artificial intelligence, encompasses the creation of computer algorithms designed to learn and make predictions based on data. These algorithms analyze data to discern patterns and relationships, enabling them to make informed decisions when presented with new data [8].
These machine learning models have been extensively explored for their ability to predict mortality in adult ICU settings [9,10], which has left a notable gap in the development of well-established models tailored specifically to pediatric critical care. While some studies have developed mortality prediction during pediatric ICU (PICU) stays [11], predicting critical events holds greater importance. Predicting critical events allows for timely interventions, which may further improve patient prognosis. There remains a shortage of machine learning models that distinguish between critical events and mortality in pediatric critical care.
Therefore, the primary aim of our study was to develop a comprehensive and validated machine learning model specifically designed to predict critical events in a tertiary PICU setting. Our model aims to provide precise predictions and early identification of such critical events in pediatric patients. As a secondary objective, we also sought to evaluate the predictive performance of the model.
MATERIALS AND METHODS
Study Setting and Data Source
This retrospective observational study was conducted in a 24-bed PICU at a tertiary children’s hospital. Patients younger than 18 years who were admitted to this PICU between January 2010 and May 2023 were eligible for inclusion. The data used in this study were obtained from the clinical data warehouse of the hospital’s electronic health records. The protocol and contents of this study were reviewed by the Institutional Review Board of Seoul National University Hospital, and exemption from written consent was approved for the participants due to the retrospective nature of this study (No. H-1408-101-605).
Data Collection and Preprocessing
The demographic data of patients (such as age and sex); their vital signs of systolic blood pressure (SBP), diastolic blood pressure (DBP), heart rate (HR), respiratory rate (RR), body temperature (BT), and oxygen saturation (SpO2) measured during PICU admission; and the measurement times were collected. Additionally, CPR or mortality events and their times of occurrence were collected.
Among the obtained vital signs, those that were non-physiologic and therefore suspected of being a keystroke error during the input process were excluded (SBP >300 mm Hg, DBP > SBP, HR >300 beats/min, and RR >120 breaths/min). For SBP, DBP, HR, and RR, whose normal ranges change with age, the data were analyzed using z-scores according to age rather than their individual values [12,13]. The z-score calculation used distribution curves and charts of vital signs by age that were derived from a previous study [14]. The time interval from the previous measurement of vital signs was defined as the measurement interval. A critical event was defined as CPR or mortality (without CPR). Additionally, the last 20 measurements obtained before a critical event occurred were defined as the critical group; in cases where a critical event did not occur, the last 20 measurements before PICU discharge were defined as the non-critical group. R software, version 4.3.1 (R Foundation for Statistical Computing, https://www.r-project.org), was used in this process, and the open packages of the generalized additive models for location scale and shape and sitar were used in the z-score calculation process [15-17].
Outcome
The main outcome of this study was how well the developed prediction model predicted critical events. The area under the receiver operating characteristic curve (AUROC; A) and the area under the precision-recall curve (AUPRC, B) were used to evaluate the model’s predictive performance.
Model Development and Test
Considering that critical events are not frequent, it was expected that the size of the non-critical group would be much larger than that of the critical group. Because excessively imbalanced datasets can cause bias in model development and performance evaluation, random undersampling was performed with a ratio of the critical group to the non-critical group of 1:10. Model development and testing were performed on the entire dataset using a five-fold cross validation method. This approach was used to separate the training dataset and the test dataset and to minimize the distortion of the results that can occur by dividing the training and the test set by specific splits. Here, the data were divided into five splits; learning occurs in four of them, while testing takes place in the remaining one, and the test split is performed five times without overlap.
Long short-term memory (LSTM) was used as the deep learning algorithm, and the z-scores for SBP, DBP, HR, and RR as well as BT, SpO2, measurement interval, age (in months), and sex composed the input layer. The model had 128 hidden layers and was trained for 1,000 epochs at a learning rate of 0.001. Python 3.8 software was used in the LSTM model training process, and open libraries such as PyTorch and scikit-learn were employed [18,19].
RESULTS
Baseline Characteristics
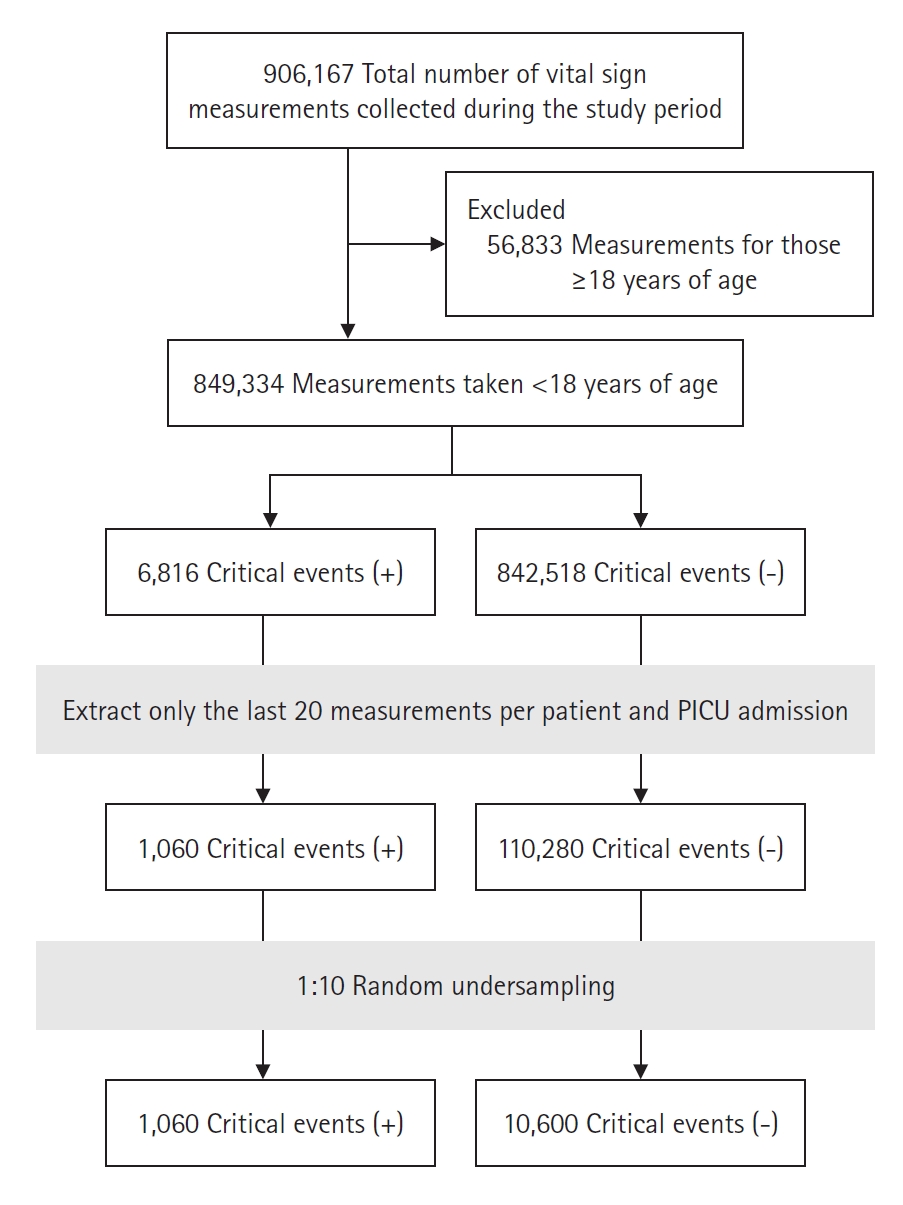
From January 2010 to May 2023, 9,161 patients were included in this study, and the number of PICU hospitalizations was 13,185. Among the 13,185 hospitalized cases, the total number of vital signs was 849,334. Because of the imbalance in the dataset, which is illustrated by the number of critical events of 6,816 and the number of non-critical events of 842,518, the vital signs for each group were sorted in order of measurement time; only the last 20 measurements were selected for analysis. After random undersampling at a 1:10 ratio, 10,600 non-critical cases and 1,060 critical cases were derived from the data (Figure 1).
Among patients with critical events, the median age was 10.5 months (3.0–53.0 months), while those without critical events had a median age of 35.0 months (5.0–92.0 months). Demographic and clinical characteristics, including sex; age; z-scores of SBP, DBP, HR, RR, BT, and SpO2; and the time interval between vital sign measurements and critical events or discharge, are summarized in Table 1. Of the 1,060 critical cases examined, 44.8% of vital sign measurements were performed within 24 hours before CPR, while 55.2% were obtained within 24 hours prior to patient mortality.
Main Outcome
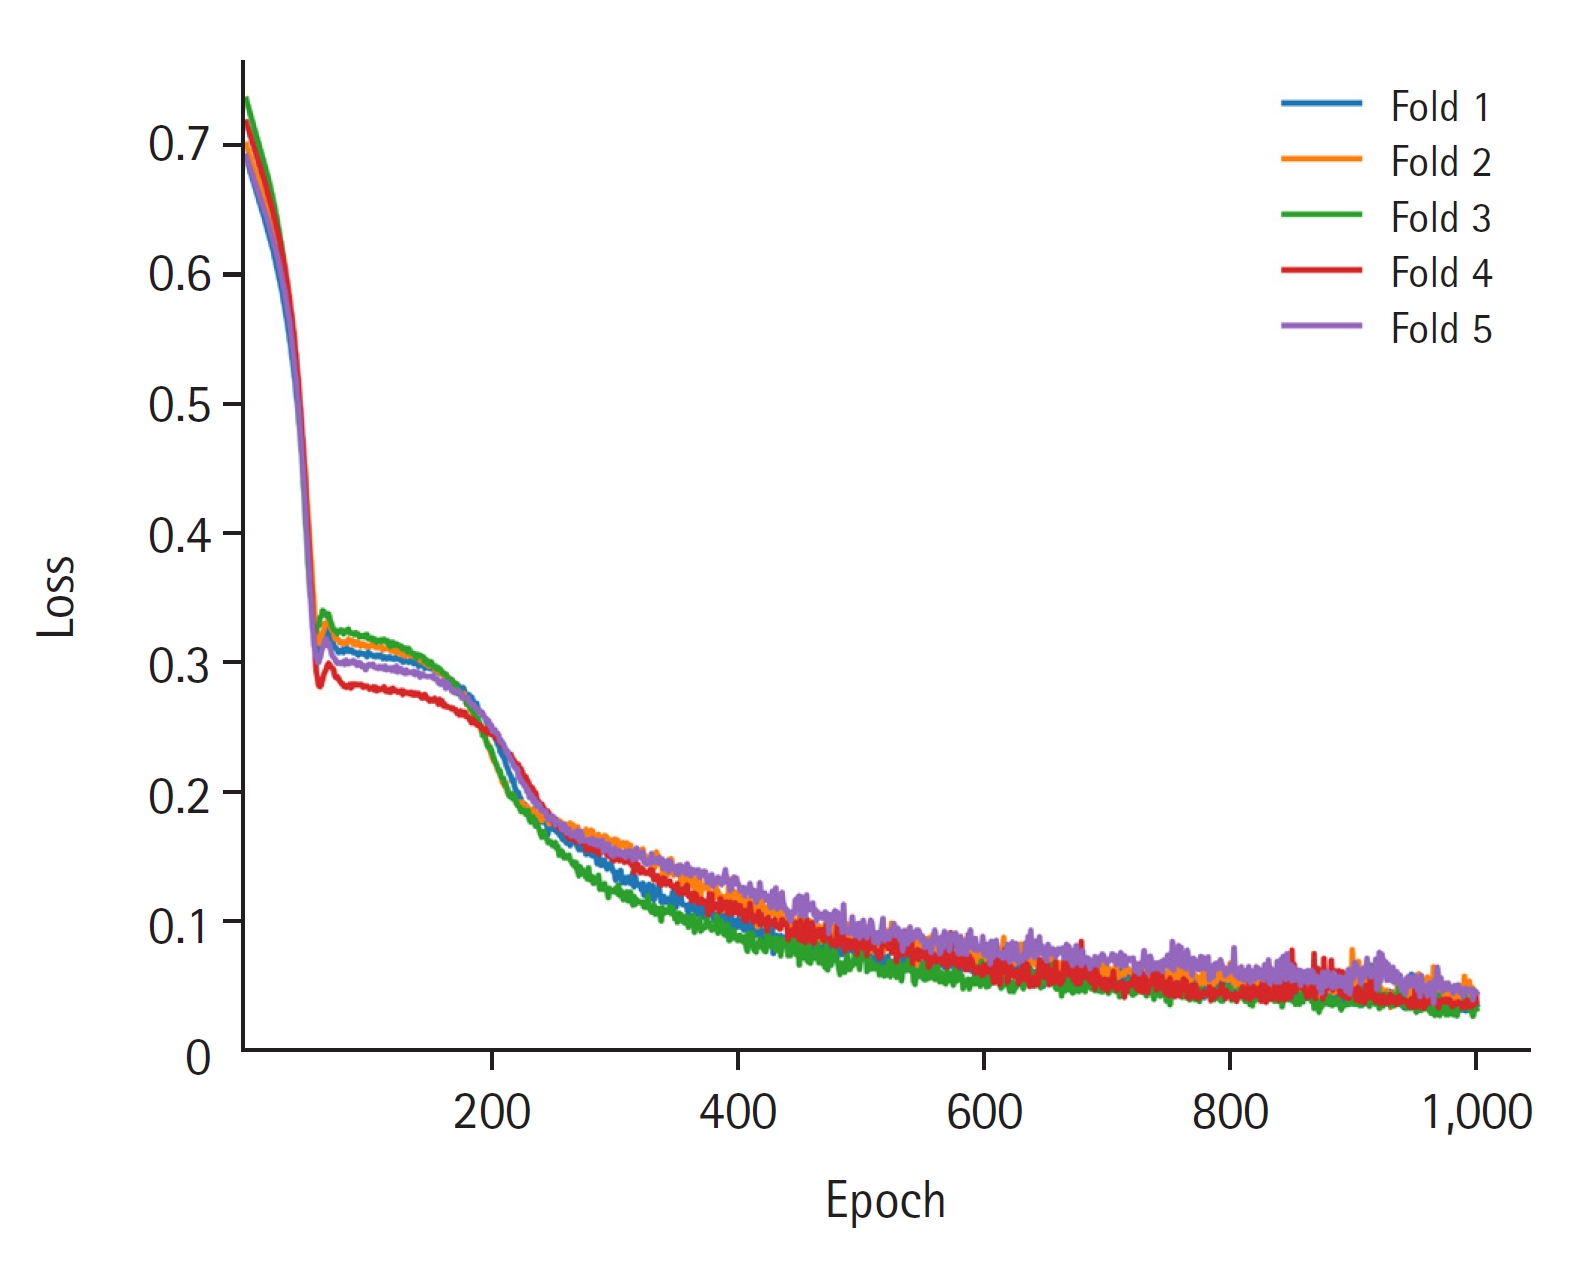
The AUROC and AUPRC values were used to evaluate the performance of the critical event prediction model developed using this study. The AUROC (95% confidence interval [CI]) was excellent at 0.988 (0.975–1.000), and the AUPRC (95% CI) was also very good at 0.862 (0.700–1.000) (Figure 2). Figure 3 shows the loss values during the training process of five folds over 1,000 epochs of training.

The area under the receiver operating characteristic curve (AUROC) and the area under the precision-recall curve (AUPRC) of the long short-term memory network model. Five-fold cross validation was performed on the developed prediction model, and each fold is displayed in a different color. CI: confidence interval.
DISCUSSION
In this study, we developed an LTSM model to predict critical events in the PICU. The model demonstrated very good predictive performance. These results indicate the effectiveness of our model in identifying pediatric patients at risk of critical events, including cardiac arrest. Our deep learning model displayed superior predictive performance compared to previous studies in the PICU setting. For instance, a study that used machine learning to predict cardiac arrest in the PICU achieved a sensitivity of 71% and a specificity of 69% at one hour before the event [20]. Our LTSM model outperformed that study, yielding a higher AUROC value and indicating improved predictive accuracy. Another study focused on time series analysis to predict cardiac arrest in the PICU, where the best model achieved an accuracy of 94% and an AUROC of 98% [21]. However, the model in that study was associated with an unacceptably high false alarm rate, while our model showed a high AUPRC value of 0.862.
While some studies have specifically developed machine learning models for predicting pediatric mortality [11,22], the focus of our model was to predict critical events. This emphasis on critical events is crucial because predicting mortality alone may not fully capture the significance of such events, as it excludes patients who survive after receiving CPR. Furthermore, our model addressed the limitations of existing clinical scores, such as the PRISM-III and PIM3 [6,7], by capturing vital sign changes throughout PICU hospitalization periods. By incorporating changes in vital signs, our model offers a more comprehensive approach to predicting critical events in pediatric patients.
Early identification of patients at risk allows prompt intervention, leading to increased chances of successful resuscitation and reduced morbidity [23,24]. By leveraging the predictive capabilities of our machine learning model, clinicians can implement proactive monitoring and interventions, ultimately improving patient outcomes and resource utilization in the PICU setting. By precisely predicting critical events, our model enables timely interventions, enhanced patient monitoring, and optimized resource allocation. However, the implementation of such a model in real-world clinical practice poses challenges, such as ensuring interpretability and trust in the model’s outputs, as well as integrating it into existing clinical workflows. Future research should focus on strategies to enhance the interpretability and transparency of the model and evaluate its practical implementation in diverse healthcare settings.
It is important to acknowledge the limitations of our study. First, the retrospective, single-center design and the specific patient population of the tertiary PICU may limit the generalizability of our findings to other PICUs. Additionally, our model focused on vital sign data and did not incorporate other potential contributing factors to critical events, such as laboratory results or mental status. The use of random undersampling to address data imbalance may introduce biases, including information loss bias, potential inaccuracies in representing the original data distribution, and possible instability in the model. Future studies should address these limitations by conducting prospective, multi-center investigations and exploring the inclusion of additional clinical variables. Furthermore, implementation of our machine learning model in real-time and in different clinical contexts, such as the emergency department and general inpatient ward, warrants further investigation.
In conclusion, our study demonstrated the potential of machine learning models for effectively predicting critical events in the PICU. By incorporating fluctuations in vital signs throughout the PICU hospitalization stay, our model offers improved predictive accuracy compared to existing clinical scores and previous studies. Future research is warranted to validate the performance of our model in diverse clinical settings and to explore its potential impact on clinical decision-making and patient outcomes.
KEY MESSAGES
▪ Our deep learning model excels at predicting critical events and enhancing early interventions and patient outcomes in the pediatric intensive care unit (PICU).
▪ This research bridges a crucial gap in pediatric critical care, offering a precise tool to distinguish between critical events and mortality, which should ultimately improve patient prognosis.
▪ The clinical impact of our model lies in its potential to revolutionize PICU care by empowering clinicians with accurate predictions and timely interventions.
Notes
CONFLICT OF INTEREST
No potential conflict of interest relevant to this article was reported.
FUNDING
This study was conducted with financial support from Seoul National University Hospital (Grant no. 0420202130).
AUTHOR CONTRIBUTIONS
Conceptualization: BL. Methodology: BL. Formal analysis: IKL, BL. Data curation: IKL, BL. Visualization: BL. Project administration: BL. Funding acquisition: BL. Writing–original draft: IKL. Writing–review & editing: BL, JDP. All authors read and agreed to the published version of the manuscript.
ACKNOWLEDGMENTS
None.


