Abstract
-
Background
- To explore the feasibility, safety, and potential benefits of administration of the anabolic steroid nandrolone to patients in the recovery phase from critical illness weakness.
-
Methods
- In this phase II, double blind, randomized, controlled trial, adult critically ill patients admitted to one of two tertiary Intensive Care Units in Western Australia for longer than 7 days with significant weakness were enrolled. Patients received nandrolone (200 mg males, 100 mg females) intramuscularly or placebo weekly for up to 3 weeks in addition to standard care. The primary outcome measures were improvement in grip strength, Medical Research Council muscle strength sum score, and functional activity level (Chelsea critical care assessment tool [CPAx]).
-
Results
- A total of 22 patients was enrolled between September 2017 and May 2019. No significant adverse events were detected. Median grip strength change was non-significantly greater in the nandrolone group (8.5 vs. 13.0, P=0.185), while hospital length of stay (36 vs. 26 days, P=0.023) and duration of mechanical ventilation (377 vs. 168, P=0.032) were lower. The discharge CPAx and intensive care unit mobility scores were higher in the nandrolone group, although there was no difference in the change in CPAx score (17.0 vs. 17.7, P=0.865). There were no changes in ultrasound-detected muscle thickness between the two groups.
-
Conclusions
- In patients with prolonged critical illness, nandrolone appears to be safe. However, a larger study, potentially combined with resistance exercise, is needed to definitively address the potential benefits of nandrolone.
-
Keywords: androgens; critical illness; intensive care; muscle strength; nandrolone; quality of life
INTRODUCTION
Intensive care unit (ICU)-acquired weakness can result from catabolism, immobility, and critical illness polymyoneuropathy and is of significant consequence to long-stay critically ill patients [1]. Despite recent advances in prevention through rehabilitation and nutrition, it is estimated that one-quarter to one-half of long-stay ICU survivors live with significant weakness as a consequence of their illness, resulting in impaired mobility and function [2,3]. The loss of lean body mass in critical illness is related to prolonged catabolism, immobility, and critical illness polymyoneuropathy, but it is also associated with an imbalance between catabolic and anabolic hormones [4-6]. Testosterone level in critically ill patients is extremely low, even in the recovery phase from acute illness [7,8]. One potential treatment is to provide anabolic support in the recovery phase from prolonged critical illness [9].
Anabolic steroids stimulate protein and muscle synthesis. The synthetic anabolic steroids nandrolone and oxandrolone exhibit significantly greater selectivity for myotropic properties, with minimal androgenic effects, potentially minimising adverse outcomes [10]. Testosterone and oxandrolone have been shown to have beneficial effects on muscle catabolism in patients with burns [11]. Wischmeyer et al. [12] suggested that while oxandrolone combined with structured exercise show clinical benefit, these trials have not been conducted in nonburn ICU populations. Nandrolone has been used successfully in a randomized controlled trial to reverse weight loss in human immunodeficiency virus/acquired immunodeficiency syndrome patients and in patients with chronic obstructive pulmonary disease to improve respiratory function and muscle wasting [13-15]. One small study has suggested nandrolone to be beneficial for patients recovering from critical illness [16].
This phase II, randomised, controlled trial was designed to explore the feasibility, safety, and potential benefits of nandrolone on muscle strength and recovery from critical illness. The primary objective of this trial was to assess whether nandrolone can improve muscle strength and functional recovery in deconditioned ICU patients.
MATERIALS AND METHODS
This investigator-initiated study was a placebo controlled, randomised clinical trial conducted in two adult tertiary ICUs in Western Australia between September 2017 and May 2019. The study was approved by the Sir Charles Gairdner and Osborne Park Hospital Human Research Ethics Committee (RGS0000001841). A prospective registration of the trial was made on ANZ Clinical Trials Registry, and a clinical trial notification was sent to the Therapeutic Goods Administration of the Australian Department of Health (CT-2016-CTN-02891). Patients provided written informed consent to participate in the trial.
Adult patients were eligible to participate if they had been admitted to the ICU for more than 7 days and had significant weakness as deemed by the treating clinician or weight loss (defined as body mass index <20 kg/m2 or greater than 10% weight loss in the previous 6 months) as a result of the ICU stay or pre-intensive care condition. Patients needed to be able to participate in physiotherapy and to be receiving nutrition at an estimated goal rate for at least 3 days prior to enrolment. Exclusion criteria were inability to consent, intercurrent septic shock (defined as infection requiring vasopressor support), prostate or breast cancer, active cardiac disease (myocardial infarction in the previous 2 weeks or ejection fraction <35%), ongoing non-curable reason for catabolic state (such as active malignancy, HIV with opportunistic infection, or inadequate nutritional intake), normal baseline level of serum testosterone, pregnancy, nephrotic syndrome (proteinuria >3 g/day) or elevated liver function test (alanine aminotransferase >5× normal), and impaired bilirubin excretion.
Patients were screened based on length of stay in the ICU and routine strength assessments conducted by the unit physiotherapy team. After applying the inclusion/exclusion criteria, patients were approached for consent by a member of the research team. Participants were randomised at a 1:1 ratio to receive nandrolone or placebo using a computer-generated randomisation list. The randomisation list was generated by an independent statistician, stratified by site and provided directly to the pharmacist responsible for preparing the study drug. As a double blind, randomized, controlled trial, the clinical teams, research staff, and patients were blinded to treatment allocation. To ensure blinding at administration, both the placebo (sterile water) and study drug were prepared in masked syringes (covered in aluminium foil) so that the contents were not visible to the person administering the treatments.
Intramuscular doses of nandrolone or placebo were administered into the lateral thigh weekly for up to a total of three doses. Female participants received 100 mg and males received 200 mg. Dose selection was based on our previous experience, as well as published data from other patient populations, and the duration was based on the likelihood of the patients remaining in hospital for ongoing administration and measurements [13,16,17]. The first dose was administered while the patient was still in the ICU, but the subsequent doses could be given when the patient had gone to the ward. The study drug was only administered if the patient was still in hospital, and not all patients received three doses.
No other changes to standard clinical management of these patients occurred. Improvements in critical illness weakness also might result from changes in physical therapy or nutrition. Estimates of daily caloric and protein intake were recorded by dietitians using food intake records, and duration of physical therapy received was recorded. The ICUs had dedicated physiotherapists, and early rehabilitation was encouraged.
The primary outcome measures were improvements in strength measures of grip strength as measured by hand dynamometry, Medical Research Council (MRC) muscle strength sum score (sum of muscle strength from 0–5 in six muscle groups on both sides; sum score range, 0–60), and functional activity level using the Chelsea critical care assessment tool (CPAx, a 10-item bedside functional assessment) [18]. Hand dynamometry, MRC, and CPAx assessment scores were measured by trained physiotherapists. Secondary outcome measures were change in body weight, mid-arm circumference, ultrasound-measured quadriceps muscle thickness, and length of ICU and hospital stays. Ultrasound measurements were performed by two trained clinicians using previously described protocols [19]. All measurements were performed at baseline and weekly until discharge. The MRC and CPAx assessment scores were measured up to hospital discharge, whereas the intensive care mobility scale (IMS; ranges from 0 (immobile in bed) to 10 (walking independently)) was measured until discharge from the ICU. Safety considerations included targeted monitoring of renal and liver function, lipid profile, and screening for new onset heart failure; virilisation; and polycythaemia. A follow-up phone call at 3 months following discharge was conducted to assess the patient’s functional state using the 36-item short form survey (SF-36) score.
As a phase II pilot study, an a priori sample size calculation to detect a specific effect size difference was not undertaken. Descriptive statistics were based on frequency distributions for categorical data and on means, standard deviations, medians, interquartile ranges, and ranges for continuous data. Group comparisons were based on treatment groups. Univariate analysis included chi-square and Fisher exact tests, as appropriate, for categorical comparisons and Mann-Whitney U-tests and t-tests for comparison of continuous outcomes. Ventilation and length of stay duration were estimated using Kaplan-Meier survival probabilities, with log-rank tests used to test group differences. Linear mixed models incorporating random subject effects were used to examine group differences in nutritional, physical rehabilitation, and hormonal measures at days 1, 7, 14, and 21 days and in pre-post MRC, CPAx, and IMS scores.
Results are summarised as predicted marginal mean and corresponding 95% confidence interval. Outcome variables were dichotomised according to accepted cut-offs (MRC score <48=ICU-acquired weakness, CPAx score ≤18=at risk of physical disability on discharge [20], and IMS score of 8 [walking with one item of assistance]). Statistical analysis was conducted using Stata 16.0 (StataCorp., College Station, TX, USA) and IBM SPSS ver. 26.0 (IBM Corp., Armonk, NY, USA). All hypothesis tests were two-sided, and P-values <0.05 were considered statistically significant.
RESULTS
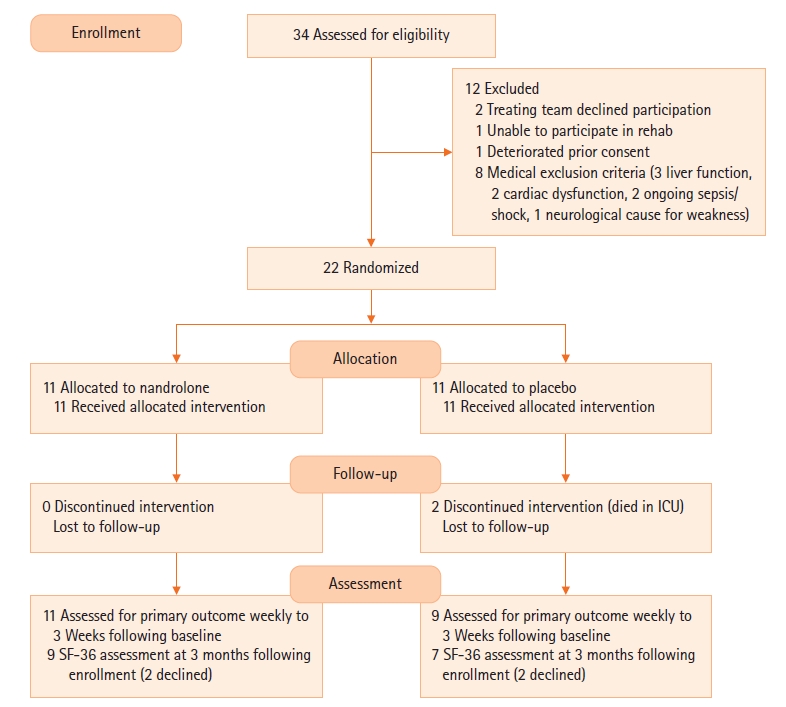
A total of 22 patients was enrolled in the study (21 at Sir Charles Gairdner Hospital and 1 at Royal Perth Hospital), with 11 in each group (Figure 1). Baseline characteristics are outlined in Table 1. Patients received their first dose of nandrolone on average at day 15 after ICU admission. Despite randomisation, there were some differences in the baseline mobility and strength characteristics between the two groups. While these might have occurred due to chance, the MRC sum score (40.5 vs. 28.2, P=0.001), CPAx tool score (24.7 vs. 14.8, P=0.011), IMS score (5.1 vs. 2.7, P=0.005), and grip strength (9.6 vs. 3.4 on the right, P=0.165) were all higher in the nandrolone groups at baseline (Table 1, Supplementary Table 1). Table 2 outlines the treatments received in the rehabilitation period, with the placebo group receiving more calories, protein, and physiotherapy input.
Table 3 shows the improvement in strength in the two groups. The MRC score change over time (from baseline to end measurement) was significantly lower in the nandrolone group (17.6 vs. 9.3, P=0.001). The median grip strength change was greater in the nandrolone group but without significance (8.5 vs. 13.0, P=0.185). The CPAx score and the discharge IMS score were higher in the nandrolone group, although there was no significant difference in the change in CPAx score from baseline to discharge (17.0 vs. 17.7, P=0.865).
More patients were discharged home in the nandrolone group than the placebo group (6 vs. 0). The lengths of ICU stay (23 vs. 12 days) and hospital stay (36 vs. 26 days) and mechanical ventilation (377 vs. 168 hours, P=0.032) were all shorter in the nandrolone group, but with no difference in hospital or 90-day survival in either group. Figure 2 shows the Kaplan-Meier curves for length of hospital stay, which was significantly shorter in the nandrolone group (Log-rank test P=0.023). Supplementary Table 1 outlines the changes in ultrasound-measured quadriceps thickness, weight, and biceps diameter over time. While there was a significant difference between the groups in terms of grip strength, when an interaction effect was calculated for the rate of change over time, this difference was no longer significant (P interaction=0.185). This was unchanged when adjusted for caloric and protein intake (P=0.182).
The SF-36 results were available for 16 patients at 3 months after enrolment. Supplementary Table 2 outlines the results by domain. All but three patients (in the nandrolone group) were living independently prior to hospitalisation. There was a non-significant trend towards improved physical functioning (56.6 vs. 40.7, P=0.32) reduced limitations due to physical functioning (58.3 vs. 17.9, P=0.076), and reduction in pain (77.6 vs. 47.4, P=0.065) in the nandrolone group but no changes in the other domains. We did not detect any adverse effects from nandrolone in the monitored blood parameters (renal, liver function, and lipids) (Supplementary Table 1). We did not record any other pre-specified significant adverse events with regards to cardiac failure or virilisation.
In terms of the feasibility of the study, Table 2 outlines the number of doses of study drug received in the two groups: seven of the patients in the nandrolone group received two doses, whereas seven of the placebo group received three doses. All patients received at least one dose. One hospital only enrolled one of the 22 patients in the trial. This appeared to be a result of their case-mix, whereby their long-stay patients were predominantly either spinal or head injury patients and were excluded from enrolment.
DISCUSSION
This study suggests that administration of nandrolone to patients with ICU-acquired weakness is both safe and feasible. There were no significant adverse events detected, and all enrolled patients were followed to the primary outcome without loss to follow-up. In examining for a sign of improved muscle strength, there were no consistent significant differences in the primary outcomes between the two groups. Although the MRC score change was greater in the placebo group, the other co-primary outcomes showed no significant difference. This finding is in line with a recent paper that examined the use of testosterone in patients with head injury who showed a non-significant improvement in grip strength and functional independence compared with placebo patients [21].
The cohort of patients in the current study appears to be representative of patients with ICU-acquired weakness. They had significant weakness, with baseline grip strength readings consistent with accepted cut-offs for ICU-acquired weakness and MRC scores well below 48 [22]. In keeping with the biological plausibility of providing anabolic steroids, these patients were testosterone deficient [8].
In the nandrolone group, more patients were discharged home from the hospital, with higher discharge CPAx and MRC scores. The SF-36 scores in pain and limitations due to physical functioning at 3 months were higher in the nandrolone group. However, as secondary outcomes, these findings can only be hypothesis generating and are not reflected by the other outcome measures. The increase in MRC score (change) was greater in the placebo group, and while grip strength change was greater in the nandrolone group, the difference was not significant. This might reflect the absence of resistance exercise in the rehabilitation program, which is a potential component of muscle hypertrophy [23].
We considered that use of ultrasound might have been able to detect more subtle changes in muscle size [19,24]. The lack of change seen might be because the duration of observation was not long enough to detect changes in muscle size, nandrolone did not accelerate muscle growth compared with placebo, or changing fluid status in recovering patients affected the readings. Muscle wasting in the ICU occurs early (in the first 1–2 weeks), and a recent study showed no correlation between caloric or protein debt and muscle thickness over 1 week [25].
This trial appeared to be feasible, although several aspects need to be examined further. For safety reasons, we set the time of enrolment at the point when the initiating critical illness had resolved and when the patient was entering the recovery phase. Not all patients identified were able to participate because their ability to perform physical rehabilitation varied. This produced a variable and patient-dependent enrolment time. The requirement for ICU admission of greater than 7 days could potentially be reduced to 5 days or more than 3 days of mechanical ventilation to increase the potential pool of patients for recruitment. A future study should also increase the number of participating sites and examine the underlying case-mix to ensure sufficient patients enrolment (such as patients with severe sepsis). Since completion of this study, the authors have set up a follow-up clinic for survivors of critical illness, which will assist with better follow-up of patients and routine assessment of SF-36 outcomes at 3 months.
In setting up the trial, we aimed to measure the traditional components of ICU recovery: nutrition and physical rehabilitation. Early rehabilitation and dietitian review are standard practices in the participating centres. Of note, the placebo group received greater calorie and protein replacement, as well as more physiotherapy time, making it harder to separate the contribution of nandrolone to patient recovery. We hypothesise that, since the placebo group had a longer duration of mechanical ventilation, they also more likely had a longer duration of nasogastric enteral feeding, which made it easier to achieve nutritional targets (especially in recently extubated patients), and longer duration of physiotherapy as they were receiving ventilator weaning assistance.
There are several limitations to this study. This was a small study, and while statistical significance has been shown for several outcomes, it is important not to place too much importance on these results. Furthermore, there appears to be a degree of mismatch in the underlying characteristics of the enrolled patients. At baseline, the placebo group (which ended up having a longer duration of mechanical ventilation) had lower MRC, CPAx, and IMS scores. The differences in length of stay are likely to reflect these baseline differences rather than the effects of nandrolone. Nonetheless, accounting for the heterogeneity of patients with ICU-acquired weakness is an important consideration. Second, the patients were predominantly enrolled from one ICU. Third, as a pilot study, there was not sufficient power to detect differences between the groups but rather to test the feasibility of the protocol and establish pilot data to guide further studies. Finally, this study did not address the optimal dosing schedule and dose. We elected to provide up to three doses based on estimates of patient hospital stay. A more prolonged course of nandrolone might be more beneficial, as used by the authors in different settings, and combined with resistance exercise to promote muscle growth [13,26]. Indeed, a single dose of nandrolone has not been shown to attenuate muscle atrophy during disuse [27].
In summary, the Growth and Anabolism in Intensive Care Survivors (GAINS) study indicates that administration of nandrolone to survivors of critical illness and follow-up of their outcomes are feasible. A larger study, potentially also with a longer duration of nandrolone administration, is needed to definitively address the potential benefits of nandrolone.
KEY MESSAGES
▪ The use of nandrolone was safe in patients in the recovery phase of prolonged critical illness (>7 days) in this pilot, randomized, controlled trial.
▪ There was no benefit of nandrolone in terms of muscle strength after 3 weeks, but a non-significant trend was observed towards improved physical functioning based on 36-item short form survey.
▪ A larger study is needed to definitively address the potential benefits of nandrolone in a similar cohort.
NOTES
-
CONFLICT OF INTEREST
No potential conflict of interest relevant to this article was reported.
-
AUTHOR CONTRIBUTIONS
Conceptualization: MHA, BW. Investigation: MHA, NT, RNP, BM, EO, AC. Data curation: RR, EF. Formal analysis: AJ. Investigation: BW, EF. Methodology: MHA, BW, NT, RNP, BM, EO, AC, AJ. Project administration: RR. Supervision: MHA. Writing–original draft: MHA. Writing–review & editing: RR, BW, NT, RNP, BM, EO, AC, EF, AJ.
Acknowledgments
We would like to acknowledge Ms. Sharon Waterson, Erina Myers, Amanda Ziatas, and Dr. Amanda Wilson for assistance with data collection.
SUPPLEMENTARY MATERIALS
Supplementary materials can be found via https://doi.org/10.4266/acc.2021.01767.
Figure 1.Consort diagram. ICU: intensive care unit; SF-36: 36-item short form survey.

Figure 2.Kaplan-Meier survival curve for hospital length of stay (LOS). (Log-rank test P=0.023).
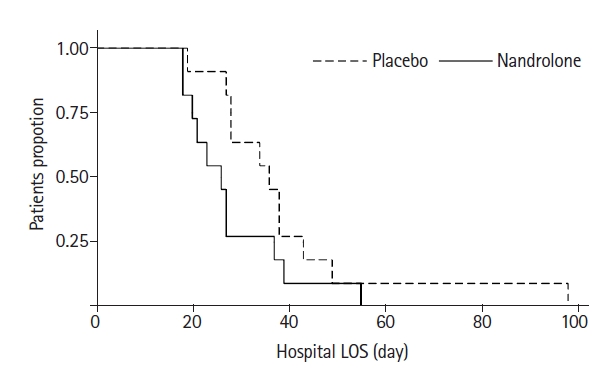
Table 1.Baseline characteristics of study participants by treatment group
|
Characteristics |
Placebo (n=11) |
Nandrolone (n=11) |
|
Demographics |
|
|
|
Female |
5 (45.5) |
4 (36.4) |
|
Age (yr) |
62.7±11.9 |
69.7±9.6 |
|
BMI (kg/m2) |
26.9±5.9 |
26.9±7.4 |
|
<18.5 kg/m2
|
1 (9.1) |
2 (18.2) |
|
>30 kg/m2
|
4 (36.4) |
4 (36.4) |
|
Residence prior to admission |
|
|
|
Own home |
11 (100) |
8 (72.7) |
|
Supports at home |
0 |
3 (27.3) |
|
APACHE III score |
37.8±14.7 |
41.6±37.8 |
|
Duration of ICU admission prior to enrolment (day) |
15.2±7.6 |
14.2±9.5 |
|
Indication for ICU admission |
|
|
|
Post-general surgical |
4 (36.4) |
4 (36.4) |
|
Neurological |
2 (18.2) |
1 (9.1) |
|
Respiratory |
3 (27.3) |
0 |
|
Cardiovascular |
2 (18.2) |
1 (9.1) |
|
Post-cardiac surgery |
0 |
3 (27.3) |
|
Renal failure |
0 |
1 (9.1) |
|
Toxicological |
0 |
1 (9.1) |
|
Testosterone levela
|
|
|
|
Male |
3.2±3.8 |
3.0±1.3 |
|
Female |
1.0±0.7 |
0.5±0.3 |
|
Baseline physical score (at enrollment) |
|
|
|
Mid-arm circumference (cm) |
|
|
|
Right |
27.6±5.0 |
27.2±6.1 |
|
Left |
27.4±4.4 |
27.3±5.8 |
|
MRC sum score |
28.2±14.5 |
40.5±8.2 |
|
CPAx score |
14.8±7.5 |
24.7±8.9 |
|
CPAx score ≤18 (at risk) |
6 (54.5) |
4 (36.4) |
|
IMS score |
2.7±1.3 |
5.1±1.9 |
|
IMS score <8b
|
10 |
9 |
|
Grip strength |
|
|
|
Left |
2.9 (0.4–7.3) |
6.5 (2.8–10.2) |
|
Right |
3.4 (0.3–6.2) |
9.6 (3.2–12.0) |
Table 2.Treatments received during rehabilitation period
|
Variable |
Placebo |
Nandrolone |
P-value |
|
Corticosteroid use |
3 (27.3) |
1 (11.1) |
0.590 |
|
Calorie intake (kJ) |
1,857±465 |
1,259±349 |
0.003 |
|
Protein intake (g/day) |
85.7±20.8 |
59.3±18.9 |
0.005 |
|
Duration of physiotherapy received (min) |
240 (173–500) |
135 (85–240) |
0.067 |
|
Number of doses received |
|
|
0.062 |
|
1
|
2 |
2 |
|
|
2
|
2 |
7 |
|
|
3
|
7 |
2 |
|
Table 3.Primary and secondary outcomes
|
Outcome |
Placebo |
Nandrolone |
P-value |
|
Primary outcome, mean (95% CI) |
|
|
|
|
MRC changea
|
17.0 (12.3–21.7) |
9.3 (5.0–13.6) |
0.017 |
|
Grip strength change (R+L)b
|
8.5 (3.9–13.1) |
13.0 (8.1–17.9) |
0.185 |
|
Grip strength change (R+L) adjusteda,b
|
8.4 (3.8–13.0) |
12.9 (8.0–17.8) |
0.182 |
|
ICU mobility score changea
|
3.0 (1.8–4.2) |
3.5 (2.3–4.6) |
0.614 |
|
CPAx score changea
|
17.0 (11.5–22.4) |
17.7 (12.3–23.2) |
0.865 |
|
Secondary outcome |
|
|
|
|
Length of invasive ventilation (hr), median (IQR) |
377 (189–454) |
168 (166–305) |
0.032 |
|
ICU length of stay (day), median (IQR) |
23 (16–27) |
12 (10–15) |
0.065 |
|
Hospital length of stay (day), median (IQR) |
36 (28–38) |
26 (20–27) |
0.023 |
|
ICU readmission rate |
3 (30) |
1 (11) |
0.582 |
|
ICU survival |
9 (82) |
11 (100) |
0.476 |
|
90 Day survival |
9 (82) |
11 (100) |
0.476 |
|
Discharge destination |
|
|
0.010 |
|
Home |
0 |
6 (54) |
|
|
Other (rehab/other hospital) |
9 (82) |
5 (45) |
|
|
Death in hospital |
2 (18) |
0 |
|
|
Discharge MRC sum score |
42.7±13.4 |
49.8±7.6 |
0.006 |
|
MRC sum score ≥48 |
4 (36.4) |
6 (54.5) |
0.673 |
|
Discharge ICU mobility scale score |
5.8±2.2 |
8.4±1.7 |
0.005 |
|
IMS score ≥8 (walking with one assist) |
3 (27.3) |
6 (54.5) |
0.637 |
|
Discharge CPAx score |
31.6±11.1 |
42.8±6.0 |
0.011 |
|
CPAx score >18 |
7 (63.6)
|
8 (72.7)
|
0.471
|
References
- 1. Kress JP, Hall JB. ICU-acquired weakness and recovery from critical illness. N Engl J Med 2014;370:1626-35.ArticlePubMed
- 2. Dinglas VD, Aronson Friedman L, Colantuoni E, Mendez-Tellez PA, Shanholtz CB, Ciesla ND, et al. Muscle weakness and 5-year survival in acute respiratory distress syndrome survivors. Crit Care Med 2017;45:446-53.ArticlePubMedPMC
- 3. Herridge MS, Tansey CM, Matté A, Tomlinson G, Diaz-Granados N, Cooper A, et al. Functional disability 5 years after acute respiratory distress syndrome. N Engl J Med 2011;364:1293-304.ArticlePubMed
- 4. Gamrin L, Andersson K, Hultman E, Nilsson E, Essén P, Wernerman J. Longitudinal changes of biochemical parameters in muscle during critical illness. Metabolism 1997;46:756-62.ArticlePubMed
- 5. Puthucheary ZA, Rawal J, McPhail M, Connolly B, Ratnayake G, Chan P, et al. Acute skeletal muscle wasting in critical illness. JAMA 2013;310:1591-600.ArticlePubMed
- 6. Preiser JC, Ichai C, Orban JC, Groeneveld AB. Metabolic response to the stress of critical illness. Br J Anaesth 2014;113:945-54.ArticlePubMed
- 7. Nierman DM, Mechanick JI. Hypotestosteronemia in chronically critically ill men. Crit Care Med 1999;27:2418-21.ArticlePubMed
- 8. Almoosa KF, Gupta A, Pedroza C, Watts NB. Low testosterone levels are frequent in patients with acute respiratory failure and are associated with poor outcomes. Endocr Pract 2014;20:1057-63.ArticlePubMed
- 9. Vincent JL. Metabolic support in sepsis and multiple organ failure: more questions than answers. Crit Care Med 2007;35(9 Suppl):S436-40.ArticlePubMed
- 10. Kicman AT. Pharmacology of anabolic steroids. Br J Pharmacol 2008;154:502-21.ArticlePubMedPMC
- 11. Miller JT, Btaiche IF. Oxandrolone treatment in adults with severe thermal injury. Pharmacotherapy 2009;29:213-26.ArticlePubMed
- 12. Wischmeyer PE, Suman OE, Kozar R, Wolf SE, Molinger J, Pastva AM. Role of anabolic testosterone agents and structured exercise to promote recovery in ICU survivors. Curr Opin Crit Care 2020;26:508-15.ArticlePubMedPMC
- 13. Gold J, Batterham MJ, Rekers H, Harms MK, Geurts TB, Helmyr PM, et al. Effects of nandrolone decanoate compared with placebo or testosterone on HIV-associated wasting. HIV Med 2006;7:146-55.ArticlePubMed
- 14. Schols AM, Soeters PB, Mostert R, Pluymers RJ, Wouters EF. Physiologic effects of nutritional support and anabolic steroids in patients with chronic obstructive pulmonary disease: a placebo-controlled randomized trial. Am J Respir Crit Care Med 1995;152(4 Pt 1):1268-74.ArticlePubMed
- 15. Creutzberg EC, Wouters EF, Mostert R, Pluymers RJ, Schols AM. A role for anabolic steroids in the rehabilitation of patients with COPD? A double-blind, placebo-controlled, randomized trial. Chest 2003;124:1733-42.ArticlePubMed
- 16. Pikul J, Sharpe MD. Use of anabolic steroid therapy in critically ill ICU patients. Crit Care 2003;7:P014. ArticlePMC
- 17. Anstey M, Desai S, Torre L, Wibrow B, Seet J, Osnain E. Anabolic steroid use for weight and strength gain in critically ill patients: a case series and review of the literature. Case Rep Crit Care 2018;2018:4545623. ArticlePubMedPMC
- 18. Corner EJ, Wood H, Englebretsen C, Thomas A, Grant RL, Nikoletou D, et al. The Chelsea critical care physical assessment tool (CPAx): validation of an innovative new tool to measure physical morbidity in the general adult critical care population. An observational proof-of-concept pilot study. Physiotherapy 2013;99:33-41.ArticlePubMed
- 19. Tillquist M, Kutsogiannis DJ, Wischmeyer PE, Kummerlen C, Leung R, Stollery D, et al. Bedside ultrasound is a practical and reliable measurement tool for assessing quadriceps muscle layer thickness. JPEN J Parenter Enteral Nutr 2014;38:886-90.ArticlePubMed
- 20. Milton A, Schandl A, Soliman I, Joelsson-Alm E, van den Boogaard M, Wallin E, et al. ICU discharge screening for prediction of new-onset physical disability: a multinational cohort study. Acta Anaesthesiol Scand 2020;64:789-97.ArticlePubMed
- 21. Ripley DL, Gerber D, Pretz C, Weintraub AH, Wierman ME. Testosterone replacement in hypogonadal men during inpatient rehabilitation following traumatic brain injury: results from a double-blind, placebo-controlled clinical pilot study. NeuroRehabilitation 2020;46:355-68.ArticlePubMed
- 22. Ali NA, O'Brien JM Jr, Hoffmann SP, Phillips G, Garland A, Finley JC, et al. Acquired weakness, handgrip strength, and mortality in critically ill patients. Am J Respir Crit Care Med 2008;178:261-8.ArticlePubMed
- 23. Bhasin S, Storer TW, Berman N, Callegari C, Clevenger B, Phillips J, et al. The effects of supraphysiologic doses of testosterone on muscle size and strength in normal men. N Engl J Med 1996;335:1-7.ArticlePubMed
- 24. Segers J, Hermans G, Charususin N, Fivez T, Vanhorebeek I, Van den Berghe G, et al. Assessment of quadriceps muscle mass with ultrasound in critically ill patients: intra- and inter-observer agreement and sensitivity. Intensive Care Med 2015;41:562-3.ArticlePubMed
- 25. Pardo E, El Behi H, Boizeau P, Verdonk F, Alberti C, Lescot T. Reliability of ultrasound measurements of quadriceps muscle thickness in critically ill patients. BMC Anesthesiol 2018;18:205. ArticlePubMedPMC
- 26. Johansen KL, Mulligan K, Schambelan M. Anabolic effects of nandrolone decanoate in patients receiving dialysis: a randomized controlled trial. JAMA 1999;281:1275-81.ArticlePubMed
- 27. Horstman A, Backx E, Smeets J, Marzuca-Nassr GN, van Kranenburg J, de Boer D, et al. Nandrolone decanoate administration does not attenuate muscle atrophy during a short period of disuse. PLoS One 2019;14:e0210823.ArticlePubMedPMC
Citations
Citations to this article as recorded by


 PubReader
 ePub Link
 Cite
Cite