Abstract
-
Background
- Some variables of the Sequential Organ Failure Assessment (SOFA) score are not routinely measured in sepsis patients, especially in countries with limited resources. Therefore, this study was conducted to evaluate the accuracy of the modified SOFA (mSOFA) and compared its ability to predict mortality in sepsis patients to that of the original SOFA score.
-
Methods
- Sepsis patients admitted to the medical intensive care unit of Songklanagarind Hospital between 2011 and 2018 were retrospectively analyzed. The primary outcome was all-cause in-hospital mortality.
-
Results
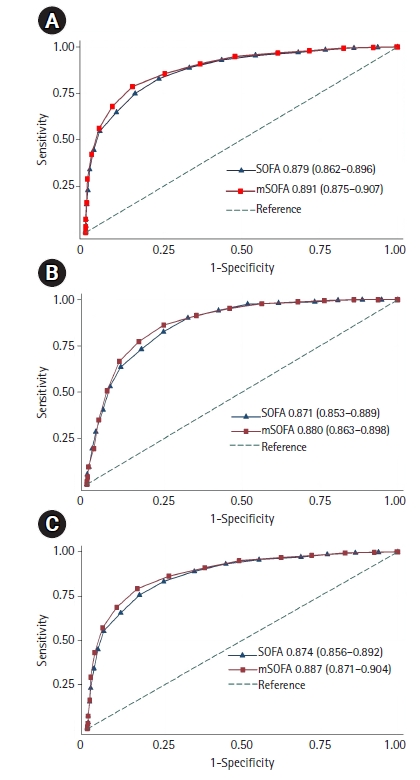
- A total of 1,522 sepsis patients were enrolled. The mean SOFA and mSOFA scores were 9.7±4.3 and 8.8±3.9, respectively. The discrimination of the mSOFA score was significantly higher than that of the SOFA score for all-cause in-hospital mortality(area under the receiver operating characteristic curve, 0.891 [95% confidence interval, 0.875–0.907] vs. 0.879 [0.862–0.896]; P<0.001), all-cause intensive care unit (ICU) mortality (0.880 [0.863–0.898] vs. 0.871 [0.853–0.889], P=0.01) and all-cause 28-day mortality (0.887 [0.871–0.904] vs. 0.874 [0.856–0.892], P<0.001). The ability of mSOFA score to predict all-cause in-hospital and 28-day mortality was higher than that of the SOFA score within the subgroups of sepsis according to age, sepsis severity and serum lactate levels. The mSOFA score was demonstrated to have a performance similar to the original SOFA score regarding the prediction of mortality in sepsis patients with cirrhosis or hepatic dysfunction.
-
Conclusions
- The mSOFA score was a good alternative to the original SOFA core in predicting mortality among sepsis patients admitted to the ICU.
-
Keywords: intensive care unit; organ failure; sepsis; shock
INTRODUCTION
Sepsis is a life-threatening condition and constitutes major health care problems around the world [1,2]. Sepsis was associated with nearly 20% of all global deaths, and the majority of sepsis cases occurred in low- or middle-income countries [1]. In 2017, the World Health Organization recommended actions to reduce the global burden of sepsis [2]. Sepsis has been defined as acute life-threatening organ dysfunction due to dysregulation of host responses to infection [3]. The Sequential Organ Failure Assessment (SOFA) score has been the most commonly used model for evaluation of organ dysfunction and failure in critically ill patients [4-6]. Because organ failure is associated with bad prognoses [5-7], several studies have reported that higher SOFA scores are associated with morbidity and mortality in various critically-ill patients [6-9]. In 2016, the third international consensus proposed new criteria for sepsis (Sepsis-3) using SOFA to substitute the Systemic Inflammatory Response Syndrome (SIRS) criterion [3]. Documented or suspected infection and an increased SOFA score of 2 or more serve as the clinical criteria for sepsis [3].
The SOFA score represents six organ systems (cardiovascular, respiratory, renal, neurological, hematological, and hepatic systems), and each system is scored ranging from 0 to 4 and is cumulated in the total score, ranging from 0 to 24 [4]. However, prior studies found that each organ component of the SOFA score had varied abilities to predict mortality. Williams et al. [9] demonstrated that neurological dysfunction was most highly associated with mortality risk; in contrast, hepatic dysfunction had a low predictive capacity for mortality risk. This is also consistent with a previous study in our intensive care unit (ICU), which showed that the hepatic component of the SOFA score conferred the least accurate mortality prediction [6]. Some variables of the SOFA score are not routinely measured in sepsis patients [10], especially in resource-limited countries [11]. Serum bilirubin was not measured in 84% of surgical cases, though it is required to calculate the Simplified Acute Physiology Score (SAPS) II [12]. Ferreira et al. [5] reported that serum bilirubin was the most commonly missing physiological variable required for SOFA score calculation in critically ill patients in ICUs. Moreover, serum bilirubin was only documented in 17.5% of sepsis patients in the emergency department [10].
Therefore, we modified SOFA (mSOFA) score by omitting the hepatic parameter while preserving the other variables of the SOFA score. We hypothesized that the ability of mSOFA to predict mortality in patients with sepsis would not be inferior to that of the original SOFA sore and could be utilized in resource-limited ICU settings. We conducted this study to determine the accuracy and ability of the mSOFA score, compared with the standard SOFA score, to predict mortality in ICU patients with sepsis.
MATERIALS AND METHODS
This study was conducted in a medical ICU at a tertiary university teaching hospital. We retrospectively analyzed sepsis patients consecutively admitted to our unit from January 2011 to December 2018. Patients 18 years of age or older with diagnostic codes of infection, sepsis, or septic shock by the International Classification of Diseases 10th revision (ICD-10) were screened for enrollment in this study. Sepsis was defined by the Sepsis-3 definition (SOFA score ≥2) [3]. Septic shock was defined by sepsis requiring vasoactive agents to maintain mean arterial pressure at 65 mm Hg minimum and serum lactate ≥2 mmol/L [3]. Patients were excluded if there were no data for serum bilirubin or lactate within 24 hours of ICU admission. Only the first admission was included in the analysis for patients who had multiple ICU admissions. The Institutional Human Research Ethic Committee approved this study (REC 60-223-14-1) and waived the need to obtain informed consent.
The SOFA score allocates 0–4 points for increasing acute organ failure severity across six organ systems; SOFA scores range from 0 to 24 [4]. The mSOFA assigns the same score points but selects only five organ systems, eliminating the hepatic component and ranging from 0 to 20. We calculated the total SOFA and mSOFA scores for component measurements during the first 24 hours of ICU admission. The primary outcome was the ability of the mSOFA score to predict all-cause in-hospital mortality, and the secondary outcomes were all-cause ICU and 28-day mortality prediction.
Statistical Analysis
Categorical variables are presented as percentages and proportions and compared with the chi-square or Fisher’s exact test. Continuous variables are presented as mean±standard deviation or median (interquartile range) and compared using the Student t-test or Wilcoxon’s rank-sum test as appropriate. The discrimination of each score was evaluated by the area under the receiver operating characteristic curve (AUC) with a 95% confidence interval (CI). We compared the difference in AUCs between the two scores using the method described by Delong et al. [13]. The AUC and odds ratio (OR) for hospital mortality for each organ system component of the SOFA score were calculated. The Yoden index was used to calculate sensitivity, specificity, and the cut-off values of SOFA and mSOFA scores [14]. We also performed subgroup analysis for age groups, cirrhosis, level of serum bilirubin, and sepsis severity to evaluate the accuracy of each score. A two-sided P-value <0.05 was considered statistically significant. Statistical analyses were performed with Stata software version 11 (Stata Corp., College Station, TX, USA).
RESULTS
Between 2011 and 2018, there were 2,019 patients with ICD-10 codes for infection, sepsis, or septic shock at our medical intensive care unit. After excluding 497 patients (Figure 1), a total of 1,522 sepsis patients, including 892 (58.6%) with septic shock, was finally analyzed. The overall all-cause in-hospital, ICU, and 28-day mortalities were 44.9%, 30.6%, and 43.6%, respectively. The cohort’s demographic data are summarized in Table 1. Of all patients, 49.2% were admitted to the ICU from the emergency department, 43.8% were admitted from general wards, and 7% were referred from other hospitals. The causative organisms and etiologies were found in 1,212 patients (79.6%), and hemocultures were positive in 461 patients (30.3%).
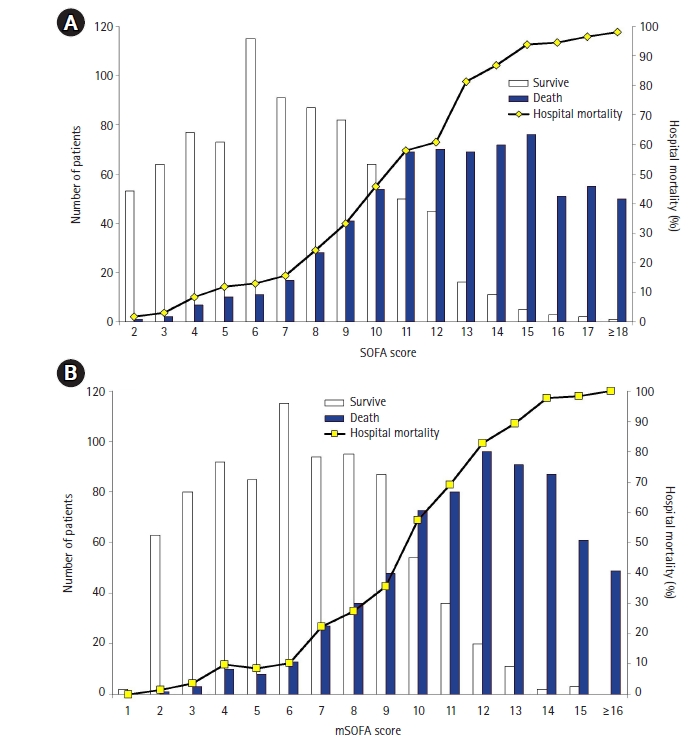
The distributions of SOFA and mSOFA scores, along with the correlation of hospital mortalities, are shown in Figure 2, respectively. Hospital mortality gradually increased according to the score. The accuracy of the SOFA and mSOFA scores for all sepsis patients and subgroups is shown in Table 2. The AUC of mSOFA was significantly higher than that of the SOFA score for predicting all-cause in-hospital mortality (0.891 [95% CI, 0.875–0.907] vs. 0.879 [0.862–0.896], P<0.001 (Figure 3A), all-cause ICU mortality (0.880 [0.863–0.898] vs. 0.871 [0.853–0.889], P=0.01 (Figure 3B), and all-cause 28-day mortality (0.887 [0.871–0.904] vs. 0.874 [0.856–0.892], P<0.001 (Figure 3C). Furthermore, the discrimination ability of the mSOFA score for predicting all-cause in-hospital and 28-day mortalities was higher than that of the SOFA score within subgroups of sepsis according to age, sepsis severity (sepsis or septic shock), as well as serum lactate levels (Table 2). The scores had similar accuracies for predicting all-cause ICU mortality in sepsis patients with liver cirrhosis or nosocomial infection. Leaving out the hepatic score did not decrease the ability to predict mortality, even in patients with underlying liver cirrhosis or hepatic dysfunction and total serum bilirubin level higher than 2 mg/dl. There were 378 patients who were excluded from analysis due to missing serum bilirubin data. Accurate all-cause in-hospital, ICU, and 28-day mortalities were consistently predicted using the mSOFA, even more accurately than that of the original SOFA score (Supplementary Table 1).
Substantial variations of each organ component of SOFA score to predict hospital mortality and ORs for all-cause in-hospital mortality are presented in Table 3. The neurological component conferred the best discrimination and was associated with the greatest mortality risk. Moreover, only neurological, cardiovascular, and hematological system scores were significantly associated with all-cause in-hospital mortality. The SOFA score threshold of 10 allowed 82.9% sensitivity and 76.5% specificity, and the mSOFA score threshold of 9 provided 85.6% sensitivity and 74.6% specificity for the prediction of all-cause in-hospital mortality.
DISCUSSION
This study demonstrated that the mSOFA score had a higher ability than the original SOFA score to predict all-cause in-hospital, ICU, and 28-day mortalities. To the best of our knowledge, our study is the first to evaluate the utility of the mSOFA score, a SOFA score without the hepatic component, to predict mortality in sepsis patients, and the results show that mSOFA can be a good alternative to the original SOFA score in resource-limited settings. Also, the mSOFA score did not affect the accuracy of mortality prediction in subgroups of sepsis patients with cirrhosis or hepatic dysfunction.
Originally, the SOFA score was developed to assess organ dysfunction and failure, not to predict mortality. Nevertheless, organ failure is an important cause of death in critically ill patients. Prior studies show that the SOFA score can effectively predict morbidity and mortality in various ICU patients, along with patients with sepsis [5-9,15-18]. Mortality prediction can help clinicians triage or classify critically ill patients, make clinical decisions, allocate resources, and evaluate ICU quality [19-21]. Several methods for predicting outcomes in ICUs are available, such as standard severity scores and organ failure scores [19,21]. The use of rapid, simple, and inexpensive methods to determine sepsis severity and predict mortality is essential in clinical practice. This is especially true in low-to-middle-income countries, where resources and financial assistance are limited, and sepsis patients have higher disease severity and mortality. Recently, the SOFA score was endorsed as a component of the diagnostic criteria for sepsis [3]. The SOFA score classifies the organ dysfunction of each system using three clinical parameters (mean arterial pressure, PaO2/FiO2, and the Glasgow coma score [GCS]) and three laboratory parameters (platelet count, serum creatinine, and bilirubin) [4]. Some variables of the SOFA score require invasive procedures, have long turnaround times, and are costly. Currently, clinicians try to modify the SOFA score for rapid, easy calculation and cost-effectiveness. A previous study demonstrated that a modified cardiovascular component of the SOFA score improved the accuracy of predicting outcomes in critically ill patients [22]. This SOFA was modified by representing the use of vasoactive agents, shock index, and serum lactate and improved the ability to predict mortality compared to the standard SOFA score [22]. In contrast, another study demonstrated that modified neurological and renal components did not improve the performance of the mSOFA score. Vasilevskis et al. [23] selected the Richmond Agitation Sedation Scale (RASS) for neurological evaluation as a substitution for the GCS in the original SOFA score. This study also found that the RASS-SOFA score had a similar ability to the GCS-SOFA score. Another study modified the renal component of the SOFA score by replacing the Kidney Disease: Improving Global Outcomes (KDIGO) criteria. The results showed that the accuracy of the KDIGO-based SOFA score was comparable with the original SOFA score [24]. Two studies mSOFA score by replacing serum bilirubin measurement with the clinical assessment of jaundice, omitted platelet count, and substituted SpO2 with PaO2 [25,26]. They found that their mSOFA score predicted mortality as well as the standard SOFA score.
There is no specific definition or diagnostic marker for sepsis-associated liver dysfunction. The Surviving Sepsis Campaign guidelines define liver dysfunction in sepsis by increased serum bilirubin >2 mg/dl or coagulopathy (international normalized ratio >1.5) [27]. Several studies demonstrated that serum bilirubin was independently associated with mortality in cirrhosis patients admitted into ICUs [28,29]. However, increased serum bilirubin level is neither a specific nor a sensitive marker for detecting liver dysfunction in sepsis patients [30]. Some dynamic parameters for determining liver function, such as indocyanine green clearance and maximal liver function capacity (LiMax) testing, should be further studied in sepsis patients [30].
Similar to prior studies, this study found that each individual organ component of the SOFA score varied in its contribution to mortality prediction. The neurological component showed the strongest association with mortality, whereas the hepatic system showed the weakest association with mortality [6,9]. In our study, removing the hepatic component from the SOFA score did not affect the accuracy in predicting sepsis mortality. A possible explanation of this finding might be that the total bilirubin level is the weakest component of the SOFA score for mortality prediction. However, we could not clearly explain why the mSOFA score showed better performance than the original SOFA score. Because our results were driven from a single-center observational study, they need to be externally validated in a larger study. We further reanalyzed our data using the Sepsis-1 definition (SIRS ≥2). A total of 1,452 patients was diagnosed with sepsis by the Sepsis-1 definition, and we found similar results regarding the performance of both the original and mSOFA scores. The mSOFA score presented a better performance for predicting hospital mortality than the original SOFA score (AUC, 0.891 [95% CI, 0.874–0.907] vs. 0.879 [0.861–0.896], P<0.001).
We also acknowledge some limitations to our study. First, our study was conducted in a single academic medical facility with both high disease severity and mortality. This should be a concern due to the possibility of site bias along with overall generalization. Second, the number of subgroup analyses for cirrhosis and hepatic dysfunction was small, so another larger study is necessary to confirm our results. In conclusion, from a single-center study of ICU sepsis patients, the mSOFA score can be a good alternative to the original SOFA score for predicting mortality in sepsis patients in resource-limited settings. Based on the different impact of each score in mortality estimation, future studies are needed to validate the modification of the SOFA score for easy and appropriate prediction of outcomes.
KEY MESSAGES
▪ The Sequential Organ Failure Assessment (SOFA) score is associated with morbidity and mortality in sepsis patients, and the third international consensus proposed new criteria for sepsis (Sepsis-3) outlines the new sepsis criterion using SOFA substituted for Systemic Inflammatory Response Syndrome.
▪ Some variables of the SOFA score are not routinely measured in sepsis patients, especially in countries with limited resources. Serum bilirubin was the most common missing variable required for SOFA score calculation.
▪ The performance of modified SOFA omitting the liver component was similar to that of the original SOFA in predicting all-cause in-hospital, intensive care unit, and 28-day mortality.
NOTES
-
CONFLICT OF INTEREST
No potential conflict of interest relevant to this article was reported.
-
AUTHOR CONTRIBUTIONS
Conceptualization: all authors. Data curation: BK. Formal analysis: BK. Funding acquisition: BK. Methodology: all authors. Project administration: BK. Visualization: all authors. Writing–original draft: BK, VV. Writing–review & editing: all authors.
SUPPLEMENTARY MATERIALS
Supplementary materials can be found via https://doi.org/10.4266/acc.2021.01627.
Supplementary Table 1.
The performance of mSOFA and original SOFA scores for predicting mortality include population without serum bilirubin (n=1,900)
acc-2021-01627-suppl.pdf
Figure 1.Study flow diagram. ICD-10: International Classification of Diseases 10th revision; MICU: medical intensive care unit; SOFA: Sequential Organ Failure Assessment.
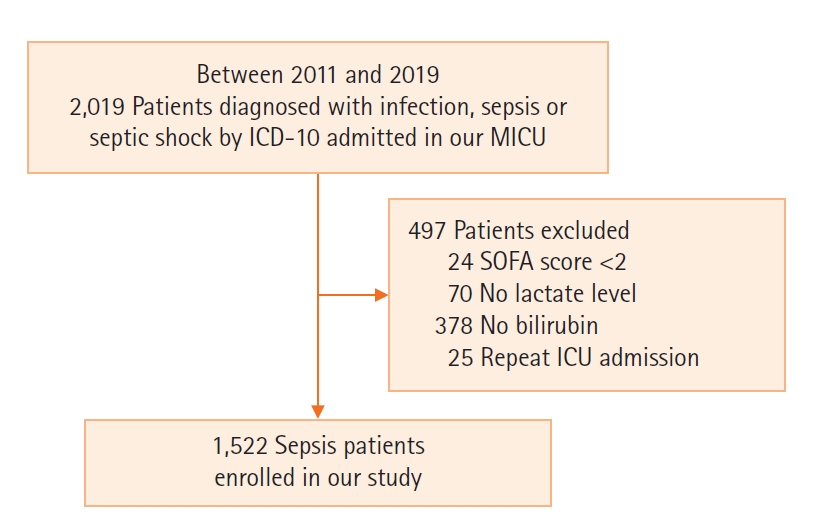
Figure 2.Distribution of Sequential Organ Failure Assessment (SOFA) (A) and modified SOFA (mSOFA) scores (B) and all-cause in-hospital mortalities.

Figure 3.Comparison of the Sequential Organ Failure Assessment (SOFA) and modified SOFA (mSOFA) areas under the receiver operating characteristic curves (AUCs) for predicting all-cause in-hospital (A), intensive care unit (B), and 28-day mortalities (C). Values are presented as AUC (95% confidence interval).

Table 1.Patient clinical characteristics stratified by hospital death
|
Variable |
All patients (n=1,522) |
Survivor (n=839) |
Non-survivor (n=683) |
P-value |
|
Age (yr) |
63 (47–75) |
61 (45–74) |
64 (50–76) |
0.001 |
|
Male |
855 (56.2) |
459 (53.7) |
396 (46.3) |
0.200 |
|
Community-acquired infection |
1,036 (68.1) |
673 (80.2) |
363 (53.1) |
<0.001 |
|
On mechanical ventilator |
1,359 (89.3) |
681 (81.2) |
678 (99.3) |
<0.001 |
|
Vasopressor used |
1,263 (83.0) |
629 (74.9) |
634 (92.8) |
<0.001 |
|
Site of infection |
|
|
|
|
|
Respiratory |
780 (51.2) |
400 (47.7) |
380 (55.6) |
0.002 |
|
Gastrointestinal |
203 (13.3) |
122 (14.5) |
81(11.8) |
0.130 |
|
Primary bacteremia |
156 (10.2) |
64 (7.6) |
92 (13.5) |
<0.001 |
|
APACHE II score |
22 (16–32) |
13 (17–21) |
32 (27–37) |
<0.001 |
|
APACHE III score |
83 (59–122) |
61 (48–77) |
127 (106–144) |
<0.001 |
|
SAPS II |
53 (39–72) |
41 (32–48) |
73 (63–85) |
<0.001 |
|
SOFA score |
10 (6–13) |
7 (5–9) |
13 (10–15) |
<0.001 |
|
mSOFA score |
9 (6–12) |
6 (4–9) |
12 (10–14) |
<0.001 |
|
Each organ component of SOFA |
|
|
|
|
|
Cardiovascular |
2.8±1.4 |
2.3±1.5 |
3.4±1.1 |
<0.001 |
|
Pulmonary |
1.9±1.2 |
1.7±1.2 |
2.1±1.2 |
<0.001 |
|
Neurological |
1.9±1.8 |
0.5±0.8 |
3.5±1.1 |
<0.001 |
|
Renal |
1.3±1.3 |
1.2±1.3 |
1.4±1.3 |
<0.001 |
|
Hematological |
0.9±1.2 |
0.7±1.1 |
1.2±1.3 |
<0.001 |
|
Hepatological |
0.9±1.1 |
0.7±1.0 |
1.1±1.3 |
<0.001 |
|
Serum lactate (mmol/L) |
2.8 (1.4–6.2) |
2 (1.1–3.9) |
4.2 (2.2–9.4) |
<0.001 |
|
ICU LOS (day) |
4 (2–8) |
4 (2–7) |
4 (2–8) |
0.410 |
|
Hospital LOS (day) |
15 (7–31) |
18 (9–35) |
12 (4–26) |
<0.001 |
|
All-cause in-hospital mortality |
683 (44.9) |
- |
- |
- |
|
All-cause ICU mortality |
466 (30.6) |
- |
- |
- |
|
All-cause 28-day mortality |
663 (43.6) |
- |
- |
- |
Table 2.The AUC of SOFA and mSOFA scores to predict hospital, ICU, and 28-day mortality
|
Population |
All-cause in-hospital mortality
|
All-cause ICU mortality
|
All-cause 28-day mortality
|
|
SOFA |
mSOFA |
SOFA |
mSOFA |
SOFA |
mSOFA |
|
All |
0.879 (0.862–0.896) |
0.891 (0.875–0.907)a
|
0.871 (0.853–0.889) |
0.880 (0.863–0.898)c
|
0.874 (0.856–0.892) |
0.887 (0.871–0.904)a
|
|
Age ≤60 yr (n=695) |
0.895 (0.872–0.919) |
0.907 (0.885–0.930)b
|
0.889 (0.865–0.913) |
0.899(0.877–0.922)c
|
0.890 (0.865– 0.915) |
0.902 (0.878–0.925)b
|
|
Age >60 yr (n=827) |
0.865 (0.840–0.889) |
0.877 (0.854–0.900)b
|
0.855 (0.829–0.881) |
0.863 (0.837–0.889)d
|
0.861 (0.836–0.885) |
0.875 (0.852–0.899)b
|
|
Cirrhosis (n=83) |
0.905 (0.843–0.967) |
0.907 (0.845–0.969)d
|
0.876 (0.792–0.959) |
0.879 (0.799–0.959)d
|
0.879 (0.802–0.957) |
0.879 (0.801–0.958)d
|
|
Total bilirubin ≥2 mg% (n=442) |
0.897 (0.868–0.926) |
0.892 (0.862–0.922)d
|
0.857 (0.823–0.892) |
0.857 (0.822–0.892)d
|
0.884 (0.852–0.915) |
0.883 (0.851–0.915)d
|
|
Total bilirubin <2 mg% (n=1,080) |
0.880 (0.859–0.901) |
0.885 (0.864–0.905)b
|
0.882 (0.861–0.904) |
0.885 (0.863–0.906)d
|
0.879 (0.858–0.899) |
0.883 (0.863–0.904)b
|
|
Community-acquired infection (n=1,036) |
0.871 (0.848–0.894) |
0.889 (0.867–0.910)a
|
0.877 (0.854–0.900) |
0.891 (0.869–0.913)a
|
0.869 (0.846–0.892) |
0.885 (0.863–0.906)a
|
|
Nosocomial-acquired infection (n=486) |
0.877 (0.847–0.907) |
0.877 (0.847–0.907)d
|
0.837 (0.803–0.872) |
0.837 (0.801–0.872)d
|
0.861 (0.828–0.894) |
0.871 (0.839–0.902)d
|
|
Septic shock (n=892) |
0.867 (0.843–0.890) |
0.880 (0.858–0.902)b
|
0.825 (0.798–0.851) |
0.836 (0.809–0.862)c
|
0.857 (0.833–0.882) |
0.871 (0.848–0.895)b
|
|
Sepsis (n=630) |
0.843 (0.807–0.879) |
0.858 (0.824–0.892)b
|
0.893 (0.860–0.926) |
0.902 (0.870–0.933)d
|
0.842 (0.806–0.879) |
0.858 (0.823–0.893)b
|
|
Lactate ≥2 mmol/L (n=972) |
0.875 (0.854–0.896) |
0.887 (0.866–0.907)b
|
0.842 (0.818–0.867) |
0.852 (0.828–0.876)c
|
0.866 (0.844–0.889) |
0.879 (0.857–0.900)b
|
|
Lactate <2 mmol/L (n=550) |
0.847 (0.810–0.884) |
0.864 (0.829–0.899)b
|
0.888 (0.852–0.923) |
0.899 (0.866–0.932)c
|
0.847 (0.809–0.884) |
0.865 (0.829–0.901)a
|
Table 3.The AUC and OR for all-cause in-hospital mortality of each organ component of SOFA score
|
SOFA score component |
AUC (95% CI) |
OR (95% CI) |
P-value |
|
Cardiovascular |
0.734 (0.710–0.757) |
1.35 (1.16–1.56) |
<0.001 |
|
Pulmonary |
0.595 (0.567–0.623) |
1.09 (0.92–1.28) |
0.320 |
|
Neurological |
0.948 (0.935–0.960) |
4.82 (4.17–5.57) |
<0.001 |
|
Renal |
0.561 (0.533–0.588) |
1.08 (0.93–1.26) |
0.280 |
|
Hematology |
0.584 (0.557–0.610) |
1.33 (1.11–1.59) |
0.002 |
|
Hepatology |
0.586 (0.559–0.612) |
1.05 (0.88–1.26) |
0.580 |
References
- 1. Rudd KE, Johnson SC, Agesa KM, Shackelford KA, Tsoi D, Kievlan DR, et al. Global, regional, and national sepsis incidence and mortality, 1990-2017: analysis for the Global Burden of Disease Study. Lancet 2020;395:200-11.ArticlePubMedPMC
- 2. Reinhart K, Daniels R, Kissoon N, Machado FR, Schachter RD, Finfer S. Recognizing sepsis as a global health priority: a WHO resolution. N Engl J Med 2017;377:414-7.ArticlePubMed
- 3. Singer M, Deutschman CS, Seymour CW, Shankar-Hari M, Annane D, Bauer M, et al. The third international consensus definitions for sepsis and septic shock (Sepsis-3). JAMA 2016;315:801-10.ArticlePubMedPMC
- 4. Vincent JL, Moreno R, Takala J, Willatts S, De Mendonça A, Bruining H, et al. The SOFA (Sepsis-related Organ Failure Assessment) score to describe organ dysfunction/failure. On behalf of the Working Group on Sepsis-Related Problems of the European Society of Intensive Care Medicine. Intensive Care Med 1996;22:707-10.ArticlePubMedPDF
- 5. Ferreira FL, Bota DP, Bross A, Mélot C, Vincent JL. Serial evaluation of the SOFA score to predict outcome in critically ill patients. JAMA 2001;286:1754-8.ArticlePubMed
- 6. Khwannimit B. A comparison of three organ dysfunction scores: MODS, SOFA and LOD for predicting ICU mortality in critically ill patients. J Med Assoc Thai 2007;90:1074-81.PubMed
- 7. Khwannimit B, Bhurayanontachai R, Vattanavanit V. Comparison of the performance of SOFA, qSOFA and SIRS for predicting mortality and organ failure among sepsis patients admitted to the intensive care unit in a middle-income country. J Crit Care 2018;44:156-60.ArticlePubMed
- 8. Safari S, Shojaee M, Rahmati F, Barartloo A, Hahshemi B, Forouzanfar MM, et al. Accuracy of SOFA score in prediction of 30-day outcome of critically ill patients. Turk J Emerg Med 2016;16:146-50.ArticlePubMedPMC
- 9. Williams JM, Greenslade JH, McKenzie JV, Chu K, Brown A, Lipman J. Systemic inflammatory response syndrome, quick sequential organ function assessment, and organ dysfunction: insights from a prospective database of ED patients with infection. Chest 2017;151:586-96.ArticlePubMed
- 10. Raymond NJ, Nguyen M, Allmark S, Woods L, Peckler B. Modified Sequential Organ Failure Assessment sepsis score in an emergency department setting: retrospective assessment of prognostic value. Emerg Med Australas 2019;31:339-46.ArticlePubMedPDF
- 11. Sendagire C, Lipnick MS, Kizito S, Kruisselbrink R, Obua D, Ejoku J, et al. Feasibility of the modified sequential organ function assessment score in a resource-constrained setting: a prospective observational study. BMC Anesthesiol 2017;17:12. ArticlePubMedPMCPDF
- 12. Engel JM, Junger A, Bottger S, Benson M, Michel A, Rohrig R, et al. Outcome prediction in a surgical ICU using automatically calculated SAPS II scores. Anaesth Intensive Care 2003;31:548-54.ArticlePubMedPDF
- 13. DeLong ER, DeLong DM, Clarke-Pearson DL. Comparing the areas under two or more correlated receiver operating characteristic curves: a nonparametric approach. Biometrics 1988;44:837-45.ArticlePubMed
- 14. Ray P, Le Manach Y, Riou B, Houle TT. Statistical evaluation of a biomarker. Anesthesiology 2010;112:1023-40.ArticlePubMedPDF
- 15. Raith EP, Udy AA, Bailey M, McGloughlin S, MacIsaac C, Bellomo R, et al. Prognostic accuracy of the SOFA score, SIRS criteria, and qSOFA score for in-hospital mortality among adults with suspected infection admitted to the intensive care unit. JAMA 2017;317:290-300.ArticlePubMed
- 16. Zhang Y, Luo H, Wang H, Zheng Z, Ooi OC. Validation of prognostic accuracy of the SOFA score, SIRS criteria, and qSOFA score for in-hospital mortality among cardiac-, thoracic-, and vascular-surgery patients admitted to a cardiothoracic intensive care unit. J Card Surg 2020;35:118-27.ArticlePubMedPDF
- 17. Probst L, Schalk E, Liebregts T, Zeremski V, Tzalavras A, von Bergwelt-Baildon M, et al. Prognostic accuracy of SOFA, qSOFA and SIRS criteria in hematological cancer patients: a retrospective multicenter study. J Intensive Care 2019;7:41. ArticlePubMedPMCPDF
- 18. Basile-Filho A, Lago AF, Menegueti MG, Nicolini EA, Rodrigues L, Nunes RS, et al. The use of APACHE II, SOFA, SAPS 3, C-reactive protein/albumin ratio, and lactate to predict mortality of surgical critically ill patients: a retrospective cohort study. Medicine (Baltimore) 2019;98:e16204.PubMedPMC
- 19. Breslow MJ, Badawi O. Severity scoring in the critically ill: part 1. Interpretation and accuracy of outcome prediction scoring systems. Chest 2012;141:245-52.ArticlePubMed
- 20. Flaatten H, Walther S. Activity- or severity-based scoring in the ICU? Acta Anaesthesiol Scand 2017;61:2-4.ArticlePubMedPDF
- 21. Baker T, Gerdin M. The clinical usefulness of prognostic prediction models in critical illness. Eur J Intern Med 2017;45:37-40.ArticlePubMed
- 22. Yadav H, Harrison AM, Hanson AC, Gajic O, Kor DJ, Cartin-Ceba R. Improving the accuracy of cardiovascular component of the sequential organ failure assessment score. Crit Care Med 2015;43:1449-57.ArticlePubMed
- 23. Vasilevskis EE, Pandharipande PP, Graves AJ, Shintani A, Tsuruta R, Ely EW, et al. Validity of a modified sequential organ failure assessment score using the Richmond Agitation-Sedation Scale. Crit Care Med 2016;44:138-46.ArticlePubMedPMC
- 24. Kotani Y, Fujii T, Uchino S, Doi K, JAKID Study Group. Modification of sequential organ failure assessment score using acute kidney injury classification. J Crit Care 2019;51:198-203.ArticlePubMed
- 25. Grissom CK, Brown SM, Kuttler KG, Boltax JP, Jones J, Jephson AR, et al. A modified sequential organ failure assessment score for critical care triage. Disaster Med Public Health Prep 2010;4:277-84.ArticlePubMed
- 26. Rahmatinejad Z, Reihani H, Tohidinezhad F, Rahmatinejad F, Peyravi S, Pourmand A, et al. Predictive performance of the SOFA and mSOFA scoring systems for predicting in-hospital mortality in the emergency department. Am J Emerg Med 2019;37:1237-41.ArticlePubMed
- 27. Dellinger RP, Levy MM, Rhodes A, Annane D, Gerlach H, Opal SM, et al. Surviving Sepsis Campaign: international guidelines for management of severe sepsis and septic shock, 2012. Intensive Care Med 2013;39:165-228.ArticlePubMedPMCPDF
- 28. Levesque E, Hoti E, Azoulay D, Ichaï P, Habouchi H, Castaing D, et al. Prospective evaluation of the prognostic scores for cirrhotic patients admitted to an intensive care unit. J Hepatol 2012;56:95-102.ArticlePubMed
- 29. Zhao H, Gu X, Zhao R, Shi Y, Sheng J. Evaluation of prognostic scoring systems in liver cirrhosis patients with bloodstream infection. Medicine (Baltimore) 2017;96:e8844.ArticlePubMedPMC
- 30. Woźnica EA, Inglot M, Woźnica RK, Łysenko L. Liver dysfunction in sepsis. Adv Clin Exp Med 2018;27:547-51.ArticlePubMed
Citations
Citations to this article as recorded by

- SOFA in sepsis: with or without GCS
Lu Wang, Xudong Ma, Guanghua Zhou, Sifa Gao, Wei Pan, Jieqing Chen, Longxiang Su, Huaiwu He, Yun Long, Zhi Yin, Ting Shu, Xiang Zhou, Yongjun Liu, Yan Kang, Jing Yan, Erzhen Chen, Bin Xiong, Bingyu Qin, Kejian Qian, Wei Fang, Mingyan Zhao, Xiaochun Ma, Xi
European Journal of Medical Research.2024;[Epub] CrossRef - Effects of prior antiplatelet and/or nonsteroidal anti-inflammatory drug use on mortality in patients undergoing abdominal surgery for abdominal sepsis
Se Hun Kim, Ki Hoon Kim
Surgery.2023; 174(3): 611. CrossRef

 , Rungsun Bhurayanontachai

 PubReader
 ePub Link
 Cite
Cite