Abstract
-
Background
- In the present study, arterial and venous blood was collected from patients who were candidates for elective coronary artery bypass grafting (CABG); the blood was stored for 28 days and cellular, biomechanical, and hematological changes in blood were compared to determine whether stored arterial blood is superior to stored venous blood.
-
Methods
- The present follow-up comparative study included 60 patients >18 years of age, with hemoglobin >14 mg/dl and ejection fraction >40% who were candidates for CABG. After induction of anesthesia, 250 ml of arterial or venous blood was drawn from patients (arterial blood group and venous blood group). Laboratory blood samples were taken at specified times from the collected blood and re-injected into the patients after CABG.
-
Results
- Significant differences were observed in pH, partial pressure of carbon dioxide (PCO2), partial pressure of oxygen (PO2), bicarbonate (HCO3), and glucose values at several time points between the groups. Other parameters such as urea and creatinine did not show any significant differences between the groups.
-
Conclusions
- Twenty-eight days of storage can have a negative effect on some of the cellular, biochemical, and hematological components of arterial and venous blood; however, the quality of stored arterial blood and venous blood does not differ significantly.
-
Keywords: Hemodilution; coronary artery bypass graft; stored blood
INTRODUCTION
Transfusion of stored blood is a common medical intervention intended to improve oxygen delivery to body tissues and reduce the complications of anemia or related medical procedures [1]. Blood is routinely stored at 2 °C–6 °C for up to 35 days in preservatives such as citrate phosphate dextrose adenine (CPDA). During storage, several physical, biochemical, and biomechanical changes occur in blood products (storage lesion) that reduce their survival and function [2]. The changes include prominent alterations in red blood cell (RBC) morphology known as red cell storage lesion and blood stored for a long period of time is more affected than when stored for a short period [3]. Storage lesion leads to reduced adenosine triphosphate (ATP) and hemoglobin (Hb) level, increased lactate level with resulting lower pH, increased lysis, minimized blood movement and oxygen transport, decreased intracellular potassium (K), and increased sodium (Na) in the cytoplasm [3-5]. Consequently, red cell storage lesion reduces efficacy of the transfused blood products which increases the chances of transfusion-related morbidities [5].
In a previous study, the extent of correlation between arterial and peripheral venous samples for blood gases and acid base status in critically ill and emergency department patients were investigated. The results showed that venous blood may be a useful alternative to arterial blood during blood gas analysis, obviating the need for arterial puncture in difficult clinical situations, especially in trauma patients, for initial emergency department assessment and early stages of resuscitation [6].
In another investigation, significant changes were observed in some biochemical parameters such as serum aspartate aminotransferase, total protein, albumin, urea, chloride, and K levels assessed at periodic intervals. These changes might be caused by spontaneous hemolysis or non-viable RBCs due to storage, thus, blood should be transfused as early as possible to prevent a negative effect on the biochemical composition of RBCs [7].
However, less evidence exists regarding changes in donated arterial and venous blood after storage. Therefore, assessing the difference in donated arterial and venous blood after storage is beneficial for managing patients in emergency conditions.
In the present study, the cellular, biochemical, and hematological changes in donated arterial and venous blood after 28 days of storage were compared in patients who were candidates for elective coronary artery bypass grafting (CABG).
MATERIALS AND METHODS
The present follow-up comparative study was conducted in hamran heart hospital in 2021 in Iran. Sixty patients >18 years of age with Hb >14 mg/dL and ejection fraction (EF) >40% scheduled for elective CABG were enrolled in the study. Subjects were selected using convenience sampling method. Sampling was continued until the required number of samples was obtained. Patients with emergency surgery, severe renal and hepatic dysfunction, hematological disorders, EF <40%, or undergoing a reoperation were excluded. The Ethics Committee of Isfahan university of medical science approved this study (ethics code IR.MUI.MED.REC.1401.114). In addition, written informed consent was obtained from all participants.
First, patients were monitored using a five-lead electrocardiogram, pulse oximetry, noninvasive blood pressure monitoring, and capnography, and their radial artery was cannulated for blood sampling. All patients were anesthetized in the same manner; general anesthesia was administered with fentanyl (5 µg/kg) as a narcotic drug, cisatracurium (0.2 mg/kg) as a muscle relaxant, and Na thiopental (5 mg/kg) as a hypnotic drug. Then, tracheal intubation was performed and the lungs were ventilated using a ventilator adjusted to produce an arterial partial pressure of carbon dioxide (PCO2) of 35–45 mm Hg. Anesthesia was maintained with propofol (100 µg/kg/min) and morphine (0.2 mg/kg). A central venous catheter was inserted into the right internal jugular vein in all patients after anesthesia induction. Patients were randomly assigned to two groups based on arterial and venous blood donation. Donated arterial blood was collected from the radial artery in patients in the arterial group and donated venous blood was obtained from the peripheral vein in patients in the venous group. Blood was slowly drawn into bags containing 50 mL CPDA-1 (Figure 1).
Acute normovolemic hemodilution, which is essential to minimize surgical blood loss, was performed immediately after induction of anesthesia and before heparin injection and starting the cardiopulmonary pump. The patient had 250 ml of arterial or venous blood drawn and simultaneously replaced with a triple volume of crystalloid (750 ml intravenous saline or Ringer's solution) through the central or peripheral venous cannula to maintain normovolemia.
The first blood sample was then sent to the laboratory for venous blood gas and arterial blood gas analyses, complete blood count, and biochemistry (creatinine [Cr], lactate dehydrogenase (LDH), albumin, Na, K, platelet, glucose, mean corpuscular hemoglobin [MCH], mean corpuscular volume [MCV], and MCH concentration [MCHC]) analysis.
The collected blood was re-injected into the patients through peripheral venous cannula after CABG and hemostasis established and protamine injected. During the blood transfusion, the second blood sample was collected from the patients and immediately sent to the hospital laboratory for analysis.
After the blood infusion, 10 ml of the blood remained in the bag, which was immediately transferred to the hospital laboratory. This sample was stored in the blood bank refrigerator at a temperature between 1 °C –6 °C for 28 days and then analyzed.
Statistical Analysis
The results are expressed as the mean± standard deviation. The Student t-test was used to compare parametric variables and the chi-square test to compare categorical variables between groups. Time course experiments of blood were analyzed using repeated measures analysis of variance with post-hoc Bonferroni for multiple comparisons at each time point. A P-value <0.05 was considered to indicate statistical significance. All the statistical analyses were performed using IBM SPSS ver. 21 (IBM Corp.).
RESULTS
In the present study, 60 patients were divided into two groups using convenience sampling: 30 in the arterial blood group and 30 in the venous blood group (Figure 1). Sampling was continued until the required number of samples was obtained. Table 1 shows that all demographic data were similar between the groups with the exception of age (P=0.003).
The results showed the changes in donated blood at three time points were significantly different in almost all parameters in both groups except hematocrit (P=0.445 in arterial group and P=0.122 in venous group) and MCH (P=0.476 in arterial group and P=0.109 in venous group). In addition, the changes in albumin were not significant in the arterial group (P=0.363) (Table 2). P-values for intervention showed the changes between the groups were not significantly different (Table 2).
As shown in Table 2, PCO2 in the venous blood group was significantly higher than in the arterial blood group immediately after donating blood (57.25±10.63 vs. 49.60±8.33) and 4 hours after donating blood (62.23±7.61 vs. 54.81±7.79). However, after 28 days of storage, significant difference was not observed in PCO2 between the groups (P=0.883).
In addition, partial pressure of oxygen (PO2) in the arterial blood group was significantly higher than in the venous blood group immediately after donating blood (190.82±124.57 vs. 68.94±18.62) and 4 hours after donating blood (131.60±61.84 vs. 71.38±20.31). After 28 days of storage, significant difference was not observed in PO2 between the groups (P=0.568). Significant differences were observed in pH (P=0.02) and bicarbonate (HCO3; P=0.021) between the groups 4 hours after donating blood. Immediately after donating blood, significant difference was observed in glucose (P=0.007) which was significantly lower in the arterial blood group than in the venous blood group (431.53±132.08 vs. 513.67±90.18) before CABG (Table 2). P-values for interaction showed no interaction between the groups in all parameters except PO2 (P=0.03) and platelets (P=0.02) (Table 2).
DISCUSSION
Anemia affects one-quarter of the global population, nearly 50% of hospitalized patients, and up to 75% of hospitalized elderly patients. A high percentage of patients (60%–66%) become anemic during intensive care unit stay. Anemia is associated with a range of postoperative consequences, major side effects, rehospitalization, duration of stay in the intensive care unit, hospital stay, and mortality [8]. Therefore, blood transfusion is a vital and life-saving measure in many emergency situations [9].
In the present study, parameters such as albumin, LDH, Cr, urea, platelets, MCHC, MCH, Hb, white blood cells (WBCs), RBCs, lactate, K, Na, MCV, and hematocrit did not show significant differences at any time point between the groups. However, arterial pH and HCO3 were higher than venous pH and HCO3 after CABG. Arterial PCO2 was lower than venous PCO2 before and after CABG. Arterial PO2 was significantly higher than venous PO2 before and after CABG. In addition, arterial glucose was lower than venous glucose before CABG. The venous blood will have a lower PO2, lower pH, and higher PCO2 than the arterial blood due to metabolism in the tissues.
The results of the present study showed the mean values of arterial Na and K were lower than venous Na and K but without statistical significance; however, these differences were significant in another study [10]. Those differences were attributed to the effect of heparin because arterial samples were collected in heparinized containers [10].
The present findings showed the changes in arterial and venous RBCs, WBCs, Hb, MCV, MCHC, and platelets were significantly different after 28 days of storage. The WBCs significantly decreased in both groups after 28 days of storage. Similarly, in previous studies, significant reduction in WBCs was observed after 35 days of storage [11,12]. In addition, WBCs were shown to constantly decrease during the 28-day storage period [13].
The results of the present study showed that MCV significantly increased in both groups, which is in agreement with previous studies in which MCV was significantly increased during storage [11,14]. The RBCs, Hb, MCHC, and platelets significantly decreased after 28 days of storage. However, albumin showed significant decrease only in the venous group after 28 days of storage.
The decreased levels might be due to hemolysis that occurs during storage. In a previous study, significant reduction was observed in RBCs at day 28 and further significantly decreased during 35 days of storage which was in agreement with our finding [11]. However, the results of the present study are in contrast to a previous study in which statistically significant changes were not observed in RBCs during the 28-day storage period [15]. During blood storage at 2 °C–6 °C, glycolysis is reduced and the amount of ATP is also reduced, thus, the structure and volume of the RBCs are changed [16].
In a previous study, Hb concentration gradually decreased during the 35-day storage period, which is in agreement with our findings and might be due to hemolysis that occurs during storage [14]. Significant reduction in MCHC was found in a previous study, similar to the results of the present study [11]. As reported in previous studies, the changes in MCH and MCHC can be the result of a deregulated mechanism of cell volume, which causes the increase in the volume of RBCs, increasing hypochromia and anisocytosis. Therefore, the decrease in MCHC apparently is the result of an increase in cell volume [17].
In the present study, platelets were significantly decreased after 28 days of storage. This finding was in agreement with Marabi et al. [11], and can be explained by the cells losing viability due to ATP depletion in addition to platelet utilization caused by micro-aggregate development [18].
Contradictory results have been reported for hematocrit. A slight decrease in hematocrit was found in both groups in the present study but without statistical significance. In a previous study, significant increase in hematocrit was observed at day 35 of storage [11], however, this finding was refuted in another study [14]. Decrease in hematocrit during storage can be attributed to depletion of RBC ATP or morphological alterations that occur during blood storage [14,19].
In addition, MCH changes were insignificant in both groups which is in agreement with a study in which the MCH changes were insignificant during 28 days of storage [15]. However, MCH reportedly decreased during the storage period in another study [20].
In the present study, significant increase in lactate was observed after 28 days of storage in both groups. Whole blood stored for more than 14 days was proposed to have reduced efficacy with increased markers of red cell storage lesion, such as increased K level, lactate, and decreased pH [1]. Based on previous studies, a decrease in pH is the direct result of the increase in lactate level due to anaerobic metabolism of glucose [21-23].
In the present study, the changes in Na and K were significantly different in each group. The results showed significant decrease in Na and significant increase in K in both groups after 28 days of storage. In agreement with our results, Antwi-Baffour et al. [24] demonstrated that K concentration in refrigerated blood increases and plasma Na concentration decreases with storage time.
The present findings indicated a significant reduction in glucose and HCO3 after 28 days of storage. However, other parameters such as LDH, urea, and Cr significantly increased in both groups after 28 days of storage.
A significant increase in K concentration and decrease in HCO3 levels from 1 day to 21 days of storage were reported in another study which is in agreement with the results of the present study [25].
In other studies, decreased concentration of plasma glucose and HCO3 and increase in K, lactate, and LDH concentration with storage were observed which confirms the results of the present study [26].
Contrary to the present study, Verma et al. [25] reported no significant changes in urea and Cr during 21 days of whole blood storage.
The glucose concentration is limited and glucose is used during storage, thus, ATP depletion and decrease in red cell viability occur concomitantly. Therefore, the energy required for operating the ATPase pump in RBCs decreases over time. Inhibition of the Na pump results in hyperkalemia and hyponatremia as observed in the present study [25].
As a result of glycolysis, the concentration of lactic acid increases which may cause a decrease in pH, subsequently significantly increasing LDH. In addition, hemolysis results in the increased concentration of LDH and the decreased concentration of RBCs, Hb, MCHC, and platelets in plasma [1,25].
Based on the results, although significant biochemical changes occurred in the donated arterial and venous blood groups during the blood storage period, the process of biochemical changes between the two groups did not show any significant difference. Therefore, arterial blood donation for blood banking cannot be recommended over venous blood donation.
KEY MESSAGES
▪ Significant changes were not found in urea and creatinine at 28 days of whole blood storage.
▪ Blood should be transfused as early as possible to prevent a negative effect on the cellular, biochemical, and hematological components of blood.
▪ After candidates for elective coronary artery bypass grafting, significant differences in pH and bicarbonate (HCO3) were observed between the arterial and venous blood groups.
NOTES
-
CONFLICT OF INTEREST
No potential conflict of interest relevant to this article was reported.
-
FUNDING
None.
-
AUTHOR CONTRIBUTIONS
Conceptualization: AY. Data curation: AY. Formal analysis: GM. Funding acquisition: MM. Methodology: AY, MM. Project administration: MM. Visualization: AY, AM. Writing–original draft: AY, MM. Writing–review & editing: AY, GM, MM.
Acknowledgments
None.
Figure 1.CONSORT flow diagram.
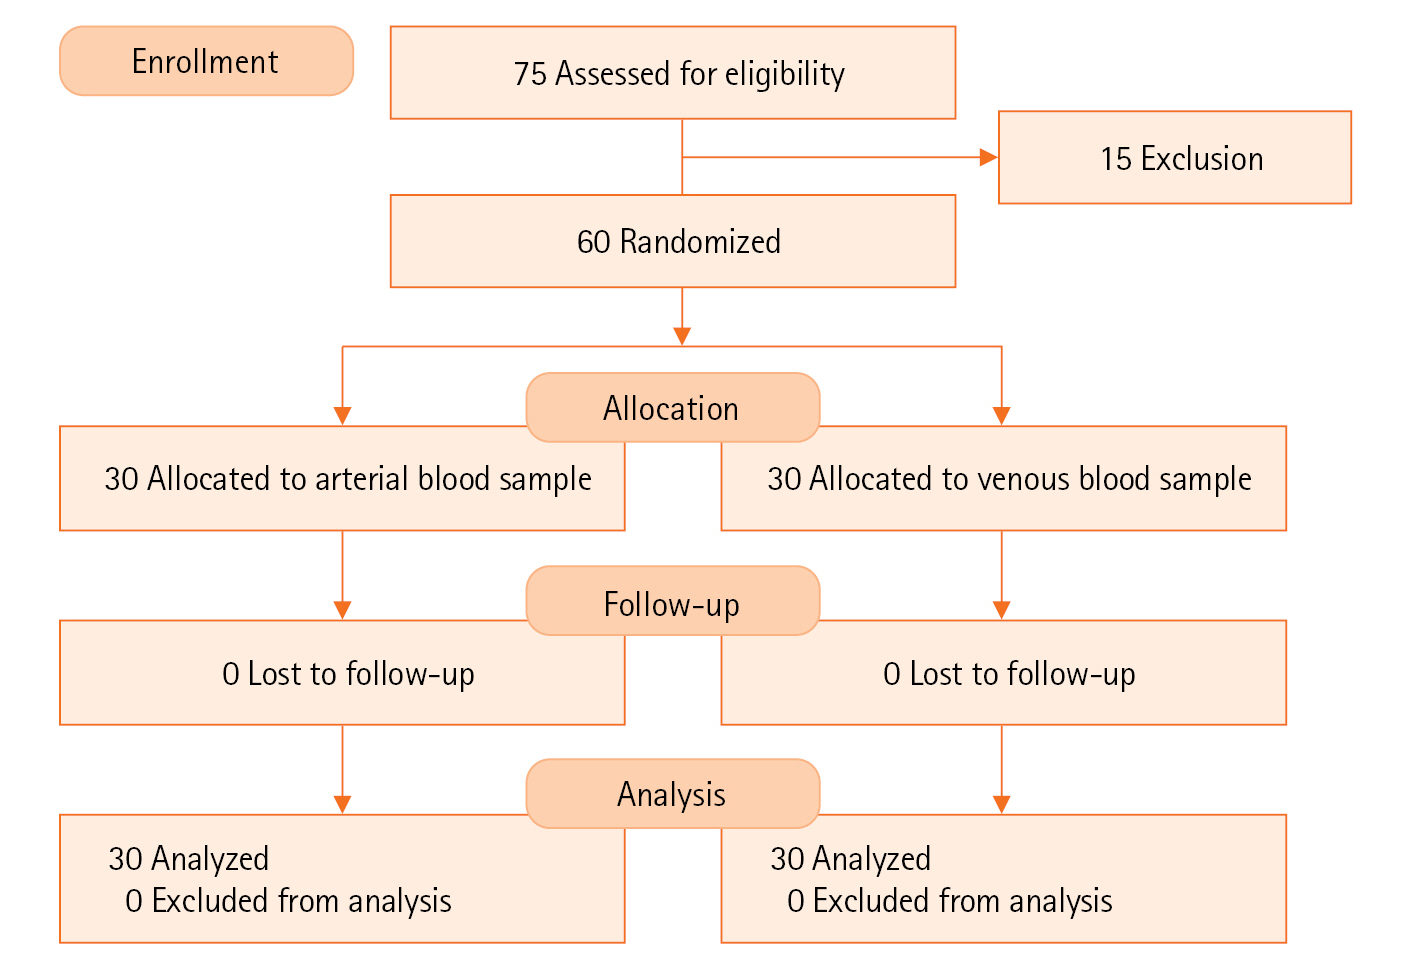
Table 1.Comparison of demographic variables between groups
|
Variable |
Arterial blood |
Venous blood |
P-value |
|
Age (yr) |
64.33±9.19 |
55.43±12.65 |
0.003 |
|
Sex |
|
|
0.125 |
|
Male |
24 (80.0) |
28 (93.3) |
|
|
Female |
6 (20.0) |
2 (6.7) |
|
Diabetes |
|
|
0.781 |
|
Yes |
10 (33.3) |
9 (30.0) |
|
|
No |
20 (66.7) |
21 (70.0) |
|
Smoking |
|
|
0.513 |
|
Yes |
5 (16.7) |
7 (23.3) |
|
|
No |
25 (83.3) |
23 (76.7) |
Table 2.Comparison between and within blood groups
|
Variable |
Time |
Arterial blood |
Venous blood |
P-value |
|
pH |
Immediately after donation |
7.15±0.11 |
6.09±0.10 |
0.05 |
|
4 Hours after donation |
7.07±0.06 |
7.04±0.06 |
0.02 |
|
28 Days after donation |
6.59±0.34 |
6.45±0.24 |
0.06 |
|
P-value |
<0.001 |
<0.001 |
|
|
P-value for interaction |
0.804 |
|
P-value for intervention |
0.288 |
|
PCO2
|
Immediately after donation |
49.60±8.33 |
57.25±10.63 |
0.003 |
|
4 Hours after donation |
54.81±7.79 |
62.23±7.61 |
0.001 |
|
28 Days after donation |
27.31±11.19 |
27.72±9.8 |
0.883 |
|
P-value |
<0.001 |
<0.001 |
|
|
P-value for interaction |
0.594 |
|
P-value for intervention |
0.239 |
|
pO2
|
Immediately after donation |
190.82±124.57 |
68.94±18.62 |
<0.001 |
|
4 Hours after donation |
131.60±61.84 |
71.38±20.31 |
<0.001 |
|
28 Days after donation |
237.82±36.90 |
243.09±31.10 |
0.568 |
|
P-value |
<0.001 |
<0.001 |
|
|
P-value for interaction |
0.033 |
|
P-value for intervention |
0.393 |
|
HCO3
|
Immediately after donation |
16.83±2.84 |
17.01±2.21 |
0.785 |
|
4 Hours after donation |
15.40±1.66 |
16.34±1.38 |
0.021 |
|
28 Days after donation |
2.09±1.74 |
1.98±1.66 |
0.800 |
|
P-value |
<0.001 |
<0.001 |
|
|
P-value for interaction |
0.500 |
|
P-value for intervention |
0.878 |
|
Na |
Immediately after donation |
146.75±5.16 |
148.51±3.66 |
0.135 |
|
4 Hours after donation |
149.52±4.03 |
150.84±4.00 |
0.210 |
|
28 Days after donation |
140.14±6.75 |
142.77±7.75 |
0.168 |
|
P-value |
<0.001 |
<0.001 |
|
|
P-value for interaction |
0.153 |
|
P-value for intervention |
0.102 |
|
K |
Immediately after donation |
3.22±1.76 |
2.85±0.50 |
0.269 |
|
4 Hours after donation |
2.63±0.46 |
2.73±0.59 |
0.494 |
|
28 Days after donation |
17.23±2.39 |
18.06±2.31 |
0.178 |
|
p-value |
<0.001 |
<0.001 |
|
|
p-value for interaction |
0.352 |
|
p-value for intervention |
0.281 |
|
Glucose |
Immediately after donation |
431.53±132.08 |
513.67±90.18 |
0.007 |
|
4 Hours after donation |
416.63±123.37 |
446.17±123.33 |
0.602 |
|
28 Days after donation |
223.63±68.40 |
235.43±60.97 |
0.538 |
|
p-value |
<0.001 |
<0.001 |
|
|
p-value for interaction |
0.503 |
|
p-value for intervention |
0.509 |
|
Lactate |
Immediately after donation |
11.39±3.66 |
12.46±3.05 |
0.224 |
|
4 Hours after donation |
21.44±4.29 |
19.34±4.14 |
0.059 |
|
28 Days after donation |
175.03±15.26 |
173.40±13.73 |
0.665 |
|
P-value |
<0.001 |
<0.001 |
|
|
P-value for interaction |
0.364 |
|
P-value for intervention |
0.543 |
|
RBC |
Immediately after donation |
3.92±0.53 |
4.11±0.45 |
0.143 |
|
4 Hours after donation |
3.95±0.75 |
3.95±0.95 |
0.986 |
|
28 Days after donation |
3.24±0.77 |
3.47±0.69 |
0.233 |
|
Immediately after donation |
<0.001 |
<0.001 |
|
|
P-value for interaction |
0.210 |
|
P-value for intervention |
0.448 |
|
WBC |
Immediately after donation |
5.45±1.39 |
5.31±1.06 |
0.643 |
|
4 Hours after donation |
5.24±1.40 |
5.74±1.53 |
0.189 |
|
28 Days after donation |
4.69±1.48 |
4.84±1.24 |
0.665 |
|
P-value |
0.001 |
0.014 |
|
|
P-value for interaction |
0.095 |
|
P-value for intervention |
0.783 |
|
Hemoglobin |
Immediately after donation |
12.12±1.66 |
12.52±1.50 |
0.327 |
|
4 Hours after donation |
11.99±2.13 |
11.83±2.11 |
0.762 |
|
28 Days after donation |
9.96±2.39 |
10.30±2.20 |
0.569 |
|
Immediately after donation |
<0.001 |
<0.001 |
|
|
P-value for interaction |
0.703 |
|
P-value for intervention |
0.867 |
|
Hematocrit |
Immediately after donation |
35.82±4.50 |
37.84±3.31 |
0.055 |
|
4 Hours after donation |
35.89±6.17 |
35.67±5.47 |
0.886 |
|
28 Days after donation |
34.61±7.82 |
35.95±7.30 |
0.497 |
|
Immediately after donation |
0.445 |
0.122 |
|
|
P-value for interaction |
0.413 |
|
P-value for intervention |
0.394 |
|
MCV |
Before CABG |
90.67±3.96 |
92.16±4.87 |
0.196 |
|
End of CABG |
90.12±6.53 |
91.58±4.44 |
0.313 |
|
28 Days after CABG |
103.14±10.21 |
104.15±11.66 |
0.722 |
|
P-value |
<0.001 |
<0.001 |
|
|
P-value for interaction |
0.105 |
|
P-value for intervention |
0.775 |
|
MCH |
Immediately after donation |
30.79±1.79 |
30.75±1.88 |
0.926 |
|
4 hours after donation |
31.05±1.71 |
31.03±2.15 |
0.971 |
|
28 Days after donation |
30.88±1.84 |
30.67±1.71 |
0.651 |
|
P-value |
0.476 |
0.109 |
|
|
P-value for interaction |
0.650 |
|
|
P-value for intervention |
0.305 |
|
MCHC |
Immediately after donation |
33.74±2.03 |
33.53±1.89 |
0.679 |
|
4 Hours after donation |
33.85±1.88 |
33.94±1.90 |
0.848 |
|
28 Days after donation |
29.85±2.27 |
29.74±2.67 |
0.864 |
|
P-value |
<0.001 |
<0.001 |
|
|
P-value for interaction |
0.211 |
|
P-value for intervention |
0.388 |
|
Platelet |
Immediately after donation |
190.30±45.67 |
170.37±41.11 |
0.081 |
|
4 Hours after donation |
171.67±40.42 |
158.07±39.57 |
0.193 |
|
28 Days after donation |
154.17±89.87 |
139.17±53.04 |
0.434 |
|
P-value |
0.045 |
0.004 |
|
|
P-value for interaction |
0.022 |
|
P-value for intervention |
0.326 |
|
Urea |
Immediately after donation |
31.50±8.71 |
32.51±9.60 |
0.672 |
|
4 Hours after donation |
32.71±9.38 |
32.61±9.02 |
0.968 |
|
28 Days after donation |
36.73±11.22 |
37.48±9.92 |
0.786 |
|
P-value |
|
<0.001 |
|
|
P-value for interaction |
0.523 |
|
P-value for intervention |
0.192 |
|
Creatinine |
Immediately after donation |
1.03±0.20 |
1.10±0.21 |
0.232 |
|
4 Hours after donation |
1.09±0.18 |
1.16±0.22 |
0.186 |
|
28 Days after donation |
1.18±0.27 |
1.22±0.28 |
0.623 |
|
P-value |
<0.001 |
<0.001 |
|
|
P-value for interaction |
0.594 |
|
P-value for intervention |
0.092 |
|
LDH |
Immediately after donation |
228.20±70.37 |
245.60±68.50 |
0.336 |
|
4 Hours after donation |
240.23±95.93 |
259.07±92.10 |
0.441 |
|
28 Days after donation |
1,306.37±352.06 |
1,230.08±396.83 |
0.434 |
|
P-value |
<0.001 |
<0.001 |
|
|
P-value for interaction |
0.133 |
|
P-value for intervention |
0.818 |
|
Immediately after donation |
Immediately after donation |
3.33±0.56 |
3.51±0.46 |
0.170 |
|
4 Hours after donation |
3.23±0.52 |
3.36±0.56 |
0.350 |
|
28 Days after donation |
3.32±0.45 |
3.48±0.44 |
0.147 |
|
P-value |
0.363 |
0.010 |
|
|
P-value for interaction |
0.579 |
|
P-value for intervention |
0.443 |
References
- 1. Oyet C, Okongo B, Onyuthi RA, Muwanguzi E. Biochemical changes in stored donor units: implications on the efficacy of blood transfusion. J Blood Med 2018;9:111-5.ArticlePubMedPMCPDF
- 2. Obrador R, Musulin S, Hansen B. Red blood cell storage lesion. J Vet Emerg Crit Care (San Antonio) 2015;25:187-99.ArticlePubMed
- 3. Lagerberg JW, Korsten H, Van Der Meer PF, De Korte D. Prevention of red cell storage lesion: a comparison of five different additive solutions. Blood Transfus 2017;15:456-62.PubMedPMC
- 4. Gholamian B, Shahnazi H, Hassanzadeh A. The effect of educational intervention based on BASNEF model for reducing internet addiction among female students: a quasi-experimental study. Ital J Pediatr 2019;45:164. ArticlePubMedPMCPDF
- 5. García-Roa M, Del Carmen Vicente-Ayuso M, Bobes AM, Pedraza AC, González-Fernández A, Martín MP, et al. Red blood cell storage time and transfusion: current practice, concerns and future perspectives. Blood Transfus 2017;15:222-31.PubMedPMC
- 6. Awasthi S, Rani R, Malviya D. Peripheral venous blood gas analysis: an alternative to arterial blood gas analysis for initial assessment and resuscitation in emergency and intensive care unit patients. Anesth Essays Res 2013;7:355-8.ArticlePubMedPMC
- 7. Upadya UB, Seema HS, Motakapalli K. Effect of blood storage on biochemical parameters assessed at periodic intervals in CPDA1 blood bags. J Clin Diagnostic Res 2018;12:5-7.Article
- 8. Unal EU, Ozen A, Kocabeyoglu S, Durukan AB, Tak S, Songur M, et al. Mean platelet volume may predict early clinical outcome after coronary artery bypass grafting. J Cardiothorac Surg 2013;8:91. ArticlePubMedPMCPDF
- 9. Namjoshi A, Bhatia GM, Chaudhari AS, Trimbake S. Effect of blood storage on electrolyte levels. Int J Res Med Sci 2021;9:438-42.ArticlePDF
- 10. Nanda SK, Ray L, Dinakaran A. Agreement of arterial sodium and arterial potassium levels with venous sodium and venous potassium in patients admitted to intensive care unit. J Clin Diagn Res 2015;9:BC28-30.ArticlePubMedPMC
- 11. Marabi PM, Musyoki SK, Amayo A. Evaluation of cellular changes in blood stored for transfusion at Bungoma County Referral Hospital, Kenya. Pan Afr Med J 2021;38:280. ArticlePubMedPMC
- 12. Spada E, Perego R, Baggiani L, Proverbio D. Haematological and morphological evaluation of feline whole blood units collected for transfusion purposes. J Feline Med Surg 2019;21:732-40.ArticlePubMedPDF
- 13. Almokhtar NA, Ali NM. CDPA-1 stored blood induced effect on some haematological parameters. J Biosci Appl Res 2021;7:104-7.Article
- 14. Batham P, Nayak R. Evaluation of haematological parameter in stored CPDA-1 whole blood. Int J Appl Res 2018;4:220-3.
- 15. Adias TC, Moore-Igwe B, Jeremiah ZA. Storage related haematological and biochemical changes of CPDA-1 whole blood in a resource limited setting. Blood Disord Transfus 2012;3:124.
- 16. Mustafa I, Al Marwani A, Mamdouh Nasr K, Abdulla Kano N, Hadwan T. Time dependent assessment of morphological changes: leukodepleted packed red blood cells stored in SAGM. Biomed Res Int 2016;2016:4529434. ArticlePubMedPMCPDF
- 17. Nogueira D, Rocha S, Abreu E, Costa E, Santos-Silva A. Biochemical and cellular changes in leukocyte-depleted red blood cells stored for transfusion. Transfus Med Hemother 2015;42:46-51.ArticlePubMedPDF
- 18. Ahmed S, Orakah J. Cellular changes in stored whole blood and the implication on efficacy of transfusion therapy in Nigeria. Internet J Third World Med 2008;8.
- 19. Arif SH, Yadav N, Rehman S, Mehdi G. Study of hemolysis during storage of blood in the blood bank of a tertiary health care centre. Indian J Hematol Blood Transfus 2017;33:598-602.ArticlePubMedPDF
- 20. Ghezelbash B, Azarkeivan A, Pourfathollah AA, Deyhim M, Hajati E, Goodarzi A. Comparative evaluation of biochemical and hematological parameters of pre-storage leukoreduction during RBC storage. Int J Hematol Oncol Stem Cell Res 2018;12:35-42.PubMedPMC
- 21. D'Alessandro A, Gevi F, Zolla L. Red blood cell metabolism under prolonged anaerobic storage. Mol Biosyst 2013;9:1196-209.ArticlePubMed
- 22. Hillyer CD, Tiegerman KO, Berkman EM. Evaluation of the red cell storage lesion after irradiation in filtered packed red cell units. Transfusion 1991;31:497-9.ArticlePubMed
- 23. Tinmouth A, Fergusson D, Yee IC, Hébert PC, ABLE Investigators; Canadian Critical Care Trials Group. Clinical consequences of red cell storage in the critically ill. Transfusion 2006;46:2014-27.ArticlePubMed
- 24. Antwi-Baffour S, Adjei JK, Tsyawo F, Kyeremeh R, Botchway FA, Seidu MA. A study of the change in sodium and potassium ion concentrations in stored donor blood and their effect on electrolyte balance of recipients. Biomed Res Int 2019;2019:8162975. ArticlePubMedPMCPDF
- 25. Verma M, Dahiya K, Malik D, PK S, Devi R, Soni A, et al. Effect of blood storage on complete biochemistry. J Blood Disord Transfus 2015;6:6. Article
- 26. Eze EM, Christian SG, Jacob RB, Jeremiah ZA, Chuku ID. Changes in plasma haemoglobin concentration in citrate phosphate dextrose adenine-1 (CPDA-1) stored blood. Int Blood Res Rev 2019;9(3):1-7.ArticlePDF
Citations
Citations to this article as recorded by


 , Alireza Yazdani1

 PubReader
 ePub Link
 Cite
Cite

