Abstract
-
Background
- Sepsis is characterized by heterogeneous immune responses that may evolve during the course of illness. This study identified inflammatory immune responses in septic patients receiving vitamin C, hydrocortisone, and thiamine.
-
Methods
- This was a single-center, post-hoc analysis of 95 patients with septic shock who received the vitamin C protocol. Blood samples were drawn on days 1–2, 3–4, and 6–8 after shock onset. Group-based multi-trajectory modeling was used to identify immune trajectory groups.
-
Results
- The median age was 78 years (interquartile range, 70–84 years), and 56% were male. Clustering analysis identified group 1 (n=41), which was characterized by lower interleukin (IL)-6, tumor necrosis factor (TNF)-α, and IL-10 levels, and these levels remained stationary or mildly increased until day 7. Conversely, group 2 (n=54) expressed initially higher IL-6, TNF-α, and IL-10 levels that decreased rapidly by day 4. There was a nonsignificant increase in lymphocyte count and a decrease in C-reactive protein level until day 7 in group 2. The intensive care unit mortality rate was significantly lower in group 2 (39.0% vs. 18.5%, P=0.03). Group 2 also had a significantly higher decrease in the mean (standard deviation) vasopressor dose (norepinephrine equivalent: –0.09±0.16 μg/kg/min vs. –0.23±0.31 μg/kg/min, P<0.001) and Sequential Organ Failure Assessment score (0±5 vs. –4±3, P=0.002) between days 1 and 4.
-
Conclusions
- There may be different subphenotypes in septic patients receiving the vitamin C protocol.
-
Keywords: ascorbic acid; hydrocortisone; immune system; septic shock; thiamine
INTRODUCTION
Sepsis is a dysregulation of host response to infection that results in organ dysfunction and frequently death [1]. Despite major advances in critical care management, sepsis-related morbidity and mortality remain markedly high [2]. Sepsis has a complex pathophysiology that involves proinflammatory and anti-inflammatory responses, oxidative burst, endothelial dysfunction, coagulation activation, and metabolic dysfunction [3]. In addition, immune responses to sepsis may be heterogeneous among patients and evolve during the course of illness. Incorporating biological heterogeneity with biomarkers could help in providing individualized treatment. A recent phase 2a trial investigating the safety and tolerability of an adrenomedullin antibody in septic shock showed that patient enrollment based on the adrenomedullin level was feasible [4]. It may also be useful to monitor the immune status of septic patients and identify those who would benefit from immunomodulatory agents.
Vitamin C has pleiotropic mechanisms of action that target multiple pathogenic pathways in sepsis. Several possible beneficial effects include antioxidant, anti-inflammatory, immunomodulatory, and antithrombotic activities [5]. A preclinical model showed that vitamin C and hydrocortisone synergistically reversed the lipopolysaccharide-induced barrier dysfunction [6]. Thiamine, the enzyme required for converting pyruvate to acetyl-CoA for entry into the Krebs cycle [7], has also been suggested as a treatment option for sepsis. However, the effects of the combination of vitamin C, hydrocortisone, and thiamine (the vitamin C protocol) on clinical outcomes have been inconsistent among previous randomized trials [8-10]. It is possible that these outcomes may have been affected by patient heterogeneity. In a recent study, a 33-mRNA classifier was able to distinguish host response endotypes with prognostic significance among patients from the Outcomes of Metabolic Resuscitation Using Ascorbic Acid, Thiamine, and Glucocorticoids in the Early Treatment of Sepsis (ORANGES) trial [11]. However, there was no difference in survival when the patients receiving the vitamin C protocol were stratified according to these endotypes. Thus, it has been a challenge to identify the optimal population of patients with sepsis who would benefit from the vitamin C protocol. The present study aimed to identify the subphenotypes of inflammatory immune responses in septic patients receiving the vitamin C protocol.
MATERIALS AND METHODS
Study Design and Population
This was a post-hoc analysis of a prospective cohort study conducted in an 835-bed university-affiliated tertiary care hospital (Chung-Ang University Hospital, Seoul, Korea) between September 2019 and July 2021. Written informed consent was obtained directly from participants who were deemed to have the capacity to make their own decisions. If a participant was not determined to be capable of consent due to current mental or physical state, a legally authorized representative was asked to provide consent. The study protocol was approved by the Institutional Review Board of Chung-Ang University Hospital (No. 1820-006-353).
Adult patients (age ≥19 years) who were admitted to the medical intensive care unit (ICU) within 48 hours of diagnosis of septic shock and received the vitamin C protocol were screened for inclusion. Patients were excluded if they were aged <19 years, did not have septic shock, did not receive the vitamin C protocol, had cardiac arrest, were moribund and not expected to survive 24 hours, had a do-not-resuscitate order, refused to participate, or did not have available blood samples. Septic shock was defined as sepsis with persisting hypotension requiring vasopressors to maintain a mean arterial pressure of ≥65 mm Hg and a serum lactate level of >2 mmol/L despite adequate fluid resuscitation [1]. However, patients with suspected infection who had serum lactate levels of <2 mmol/L but required high-dose vasopressors were also screened.
The vitamin C protocol involved a combination of intravenous vitamin C 1.5 g every 6 hours for 4 days, hydrocortisone 50 mg every 6 hours for 7 days, and thiamine 200 mg every 12 hours for 4 days [12]. Patient management was performed according to the recommendations from the 2016 Surviving Sepsis Campaign guidelines [13].
Data Collection and Variable Definition
Baseline data including age, sex, body mass index, incidence of comorbidities, nosocomial infection, bacteremia, and acute respiratory distress syndrome (ARDS), cause of sepsis, Acute Physiology and Chronic Health Evaluation (APACHE) II score [14], Sequential Organ Failure Assessment (SOFA) score [15], antibiotics, mechanical ventilation, and renal replacement therapy were collected. Clinical data of vital signs, laboratory tests, vasopressor dose, SOFA score, fluid intake, and output volumes within the first 4 days after ICU admission were also collected. The daily vasopressor dose was acquired at 07:00 and converted to an equivalent norepinephrine dose [16]. Moreover, the time of shock onset and of vitamin C protocol initiation and discontinuation were recorded. ARDS was diagnosed using the Berlin definition [17]. Vasopressor weaning was defined as not receiving vasopressors for ≥48 hours. Ventilator weaning was determined as being free from ventilator support for ≥48 hours. Superinfection was determined as a diagnosis of a new microbiological infection that occurred ≥48 hours after admission and required a new course of antibiotics.
Biomarker Measurement
Blood samples were prospectively collected at three time points after septic shock diagnosis: days 1–2, 3–4, and 6–8. The samples were evaluated for interleukin (IL)-6, tumor necrosis factor (TNF)-α, and IL-10 levels by blinded laboratory physicians, using the sandwich enzyme-linked immunosorbent assay kit (human IL-6/TNF-α/IL-10 Quantikine ELISA Kit, R&D Systems). In addition, lymphocyte counts from complete blood cell counts and C-reactive protein (CRP) levels at days 1–2, 3–4, and 6–8 after septic shock diagnosis were recorded.
Statistical Analysis
Continuous data were presented as the mean (standard deviation [SD]) or as the median (interquartile range [IQR]) and were compared using the Mann-Whitney U-test. Categorical data were presented as the number (percentage) and were compared using the chi-square test or Fisher’s exact test, as appropriate. Missing values of lymphocyte count, CRP level, lactate level, norepinephrine equivalent dose, and inflammatory biomarker level were imputed using the last observation carried forward (LOCF) approach. For missing SOFA scores, a maximum SOFA score of 24 was assigned to deceased patients, and the LOCF approach was used for discharged patients [18].
To define the trajectories of serial biomarker patterns regardless of clinical information, group-based multi-trajectory modeling (GBMTM) was performed based on longitudinal measurements (days 1–2, 3–4, and 6–8) of lymphocyte count and CRP, IL-6, TNF-α, and IL-10 levels. Briefly, GBMTM is an application of finite mixture modeling designed to identify latent clusters of individuals following similar trajectories across multiple variables of interest [19]. Maximum likelihood was used to determine both the trajectory shape for each group and the estimated probabilities of each individual belonging to each trajectory group. The Akaike information criterion and the Bayesian information criterion were used for measuring the adequacy and fit of trajectory model and final model selection. Standardization (centering and division by the sample SD) was performed to enable comparisons among the measurements of different biomarkers [20].
Baseline characteristics and inflammatory biomarkers, clinical course, and outcomes were compared between the identified trajectory groups. To minimize survivorship bias, a rank-based statistical analysis was performed by applying a worst-rank SOFA score to deceased patients. However, this may have introduced additional sources of bias. Thus, a sensitivity analysis was conducted to test the consistency of the main results, with the SOFA scores recalculated excluding those of the deceased patients. Multivariable Cox proportional hazard regression was performed to quantify the association of baseline characteristics and of the trajectory groups with 60-day mortality. Significant variables in the univariate analysis (of <0.05) were included in the multivariate analysis with stepwise backward selection. Survival curves were plotted and compared between the trajectory groups using Cox regression. All statistical analyses were performed using SAS software ver. 9.4 (SAS Institute) and the corresponding implementation PROC TRAJ, freely available at https://www.andrew.cmu.edu/~bjones/index.htm. All tests were two tailed, and differences were considered statistically significant at a P-value of <0.05.
RESULTS
Patient Characteristics
Among the 392 patients identified with sepsis, 95 had septic shock diagnosis and were analyzed (Figure 1). The median age was 78 years (IQR, 70–84 years), with a higher proportion of men (56%). In total, 26 patients (27.4%) died in the ICU. The baseline characteristics of the survivors and non-survivors are described in Supplementary Table 1. Non-survivors were more likely to be immunosuppressed, have pneumonia, have higher APACHE II and SOFA scores, and have higher requirements for mechanical ventilation and renal replacement therapy. The mean (SD) duration of vitamin C administration was 4.0±0.9 days for survivors and 4.0±1.8 days for non-survivors (P=0.12). The median time from shock onset to initiation of the vitamin C protocol was significantly shorter in survivors (1 hours [IQR, 0–6] vs. 4 hours [IQR, 2–7], P=0.02). Violin plots showing the distribution of pooled time are presented in Supplementary Figure 1. Baseline (days 1–2) lymphocyte count and CRP, IL-6, TNF-α, and IL-10 levels were similar between the groups (Supplementary Tables 1 and 2).
The clinical parameters at days 4 and 7 in ICU survivors and non-survivors are shown in Supplementary Table 3. Compared to non-survivors, survivors had a significantly greater decrease in vasopressor dose and SOFA score between days 1 and 4 (Supplementary Table 3, Supplementary Figure 2). Inflammatory biomarkers at days 3–4 and 6–8 for ICU survivors and non-survivors are shown in Supplementary Table 4 and Supplementary Figure 3. Survivors had a significantly higher lymphocyte count and lower levels of CRP, IL-6, IL-10, and IL-10/TNF-α at days 3–4 and 6–8.
Clustering Analysis
GBMTM categorized the 95 patients into two groups based on temporal measurements of lymphocyte count and CRP, IL-6, TNF-α, and IL-10 levels (Table 1, Figure 2). The levels of IL-6, TNF-α, and IL-10 at day 1 were significantly lower in group 1 (n=41, 43%) than in group 2 (n=54, 57%). In group 1, the levels remained stationary or mildly increased until day 7. The day 1 mean (SD) of IL-6, TNF-α, and IL-10 levels peaked at 558.6±1,664.5 pg/ml, 37.1±32.4 pg/ml, and 130.6±194.8 pg/ml, respectively, in group 2. However, the levels decreased rapidly by day 4. Inflammatory biomarkers at days 1–2, 3–4, and 6–8 in groups 1 and 2 are summarized in Supplementary Table 5. All measurements were fully captured without any missing values at baseline (days 1–2). During the follow-up, missing values were identified and imputed in 14/95 patients (15%). Details of blood sampling including the reasons for missing samples are listed in Supplementary Table 6. Both groups showed low lymphocyte counts and high CRP levels at day 1. However, group 2 showed a greater increase in mean (SD) lymphocyte count (102±754/mm3 vs. 272±1,517/mm3, P=0.29) and a greater decrease in mean (SD) CRP level (–98±126 mg/L vs. –134±123 mg/L, P=0.13) between days 1 and 7, although these differences were not statistically significant (Figure 2, Supplementary Table 7).
Comparison of Baseline Characteristics between the Trajectory Groups
The baseline characteristics were not significantly different between the groups, although patients in group 1 were more likely to be immunosuppressed (Table 2). Immunocompromised patients showed lower lymphocyte counts and higher TNF-α and IL-10 levels, whereas immunocompetent patients showed a greater decrease in IL-6 levels between days 1 and 4 (Supplementary Figure 4). All patients were treated with antibiotics, and the rates of mechanical ventilation and renal replacement therapy were similar between the groups. The lactate level and vasopressor dose were significantly higher for group 2. The mean (SD) duration of vitamin C administration was significantly longer for group 2 (3.6±0.9 days vs. 4.4±1.2 days, P=0.002), although the difference was not statistically significant after the exclusion of the deceased patients (3.9±0.7 days vs. 4.4±1.3 days, P=0.08). The median (IQR) time from shock onset to initiation of the vitamin C protocol was 3 hours (1–6) in group 1 and 1 hours (0–7) in group 2 (P=0.36). Violin plots showing the distribution of pooled time are presented in Supplementary Figure 5.
Comparison of Clinical Courses and Outcomes between the Trajectory Groups
The clinical outcomes in groups 1 and 2 are summarized in Table 3. The ICU mortality rates were 39.0% (16/41 patients) for group 1 and 18.5% (10/54 patients) for group 2 (P=0.03). Compared with group 1, group 2 had a significantly higher decrease in mean (SD) vasopressor dose (norepinephrine equivalent, –0.09±0.16 μg/kg/min vs. –0.23±0.31 μg/kg/min, P<0.001) and SOFA score (0±5 vs. –4±3, P=0.002) between days 1 and 4 (Table 3, Figure 3). Meanwhile, no significant differences were observed between the groups regarding net fluid retention, vasopressor weaning rate, vasopressor-free days at day 28, ventilator weaning rate, ventilator-free days at day 28, and hospital length of stay. With respect to mortality, the rates were also lower in group 2, but only the 28-day mortality was significantly different from that in group 1. Meanwhile, the rates of superinfection were similar between the groups. The clinical parameters on days 4 and 7 in groups 1 and 2 are listed in Supplementary Table 7. No significant differences were observed between the groups regarding SOFA scores on days 4 and 7 after the exclusion of deceased patients (Supplementary Table 8).
Association between Trajectory Group Inclusion and 60-Day Mortality
After adjustment for confounding factors, the independent risk factors of mortality were higher APACHE II score (adjusted hazard ratio [HR], 1.09; 95% confidence interval [CI], 1.04–1.14; P<0.001) and longer hydrocortisone treatment (adjusted HR, 1.14; 95% CI, 1.01–1.30; P=0.04) (Table 4). Meanwhile, inclusion in group 2 was significantly associated with decreased mortality (adjusted HR, 0.32; 95% CI, 0.16–0.64; P=0.001) (Table 4, Supplementary Figure 6).
DISCUSSION
The present study based on clustering analysis of lymphocyte count and CRP, IL-6, TNF-α, and IL-10 levels identified two subphenotypes of inflammatory immune responses in septic patients receiving the vitamin C protocol. One type involved sustained levels of IL-6, TNF-α, and IL-10 (group 1), while the other involved higher initial levels of these cytokines that rapidly declined thereafter (group 2). The baseline characteristics were similar between the trajectory groups, but group 2 demonstrated a better clinical course and lower ICU mortality. Lastly, inclusion in group 2 was independently associated with a lower risk of 60-day mortality.
One of several barriers to the effective treatment of critical illness has been discovering the optimal population of patients who would benefit from specific agents. Several studies suggest that more personalized treatment modalities can be considered via the identification of subphenotypes [21-23]. Interestingly, among patients from the Vasopressin vs. Norepinephrine as Initial Therapy in Septic Shock (VANISH) trial with the immunocompetent endotype, the mortality rate was higher among those treated with corticosteroids than among those treated with placebo [23]. In the current study, two trajectory groups were found to have unique cytokine signatures: group 1 involved persistent immune dysregulation, while group 2 involved a recovered well-balanced immune system after an initial adaptive response. Notably, the patients in these groups had markedly different clinical courses and outcomes despite having similar baseline characteristics.
However, it was difficult to establish a direct effect of the vitamin C protocol on improvement of the immune status owing to the lack of a control group. However, in a phase 1 trial, patients administered with high-dose vitamin C (200 mg/kg/day) showed significantly lower inflammatory biomarker levels than those who received the placebo [24]. In a recent randomized trial of vitamin C for critically ill patients with coronavirus disease 2019, the IL-6 level on day 7 was lower in the treatment group than in the placebo group [25]. Interestingly, the survival benefit was evident in those with a higher baseline SOFA score, and the current study found consistent results that patients with initially higher lactate level, vasopressor dose, and inflammatory biomarker level had better outcomes.
Dynamic measures of variables may be more important than static measures. In this study, single values of baseline lymphocyte count and CRP, IL-6, TNF-α, or IL-10 levels were not useful in predicting outcomes, whereas the measurements at later time points provided prognostic information. Bhavani et al. reported a novel method to identify four sepsis subphenotypes based on longitudinal temperature trajectories [26]. Among these, the “hyperthermic, fast resolvers” showed the lowest mortality rate. There was no immunological basis for the proposed temperature-based subphenotypes, although the “hyperthermic, fast resolvers” may be similar to that of group 2 (high IL-6, TNF-α, and IL-10 levels at day 1 but rapidly decreased at day 4) in the present study. These findings support that quicker reversal of the pathophysiological process of sepsis should lead to better survival [27].
IL-6 acts as a crucial cytokine in the systemic inflammatory response, especially during tissue injury and organ dysfunction [28]. Meanwhile, IL-10 has a key role in modulating anti-inflammatory and immunosuppressive responses [29]. Previous studies have shown that low levels of IL-6 and IL-10 during the initial phase of septic shock were significantly associated with disease severity and survival [30,31]. The decreased IL-6, TNF-α, and IL-10 levels in group 2 and their value in predicting mortality are consistent with the results of preclinical studies showing that vitamin C administration to human monocytes decreased the levels of proinflammatory cytokines [32]. Reduced lymphocyte count and impaired lymphocyte function are common features of sepsis-related immunosuppression [33]. Lastly, CRP exerts both proinflammatory and anti-inflammatory effects, and its elevation can be considered as a contributing factor to persistent inflammation/immunosuppression and catabolism syndrome [34,35]. In the present study, the lymphocyte count was higher and the CRP level was lower in group 2 than in group 1 by day 7. Taken together, these findings support the relationship between immune trajectories and clinical outcomes in patients with sepsis receiving the vitamin C protocol and will also be helpful in identifying patients who would better respond to treatment.
The main strength of the current study was the use of clustering analysis of inflammatory immune responses. Unlike previous randomized trials, the vitamin C protocol in this study was initiated earlier within an average of 4 hours after shock onset, and the interval between shock onset and vitamin C administration was significantly shorter in survivors. Furthermore, the duration of vitamin C administration was significantly longer in group 2. These are consistent with previous reports suggesting that early or long-term vitamin C administration can improve patient outcomes [36,37].
However, this study has several limitations. First, the generalizability of the results are limited by the single-center design, relatively small number of patients, and the use of random set of biomarkers to define the trajectories. However, the small study population was a result of strict patient selection to ensure standardization and reproducibility of biomarker measurements. Second, there was no control group, and the effect of other sepsis management strategies on the improvement in the clinical outcomes of group 2 could not be distinguished. In addition, vitamin C levels were not closely monitored; thus, it was unclear whether the vitamin C protocol had a direct effect against septic shock. Third, a considerable proportion of patients were excluded because of their refusal to participate or the unavailability of blood samples. It is possible that the inclusion of these patients might have influenced the modeling. Some of the included patients also had missing data owing to death or hospital discharge, and the LOCF approach may be inadequate to minimize this bias. Fourth, subgroup analysis among different sepsis subpopulations and validation of clustering analysis results were not feasible owing to the small sample size. Fifth, the current trajectory model requires serial biomarker data, and this may limit its immediate clinical use. However, survival prediction in sepsis is also currently challenging owing to the lack of available tools. Sixth, the patients were not tested for relative adrenal insufficiency. In the presence of relative adrenal insufficiency, there may be a high likelihood of favorable response to hydrocortisone, which may also explain the outcomes of group 2. Seventh, the associations between the study groups and SOFA scores were attenuated after the exclusion of deceased patients. Lastly, this study included many older patients, reflecting the high rate of ICU admission among older patients in Korea. Our results should be validated in a large placebo-controlled trial.
In conclusion, there may be different subphenotypes in septic patients receiving the vitamin C protocol. Adequate initial adaptive responses with elevated IL-6, TNF-α, and IL-10 levels followed by a restoration of a well-balanced immune system with a rapid decline in the levels of these biomarkers are associated with better clinical course and outcomes. The ability to define the immune status of patients with sepsis may contribute to the success of future clinical trials of immunomodulatory therapies through the identification of the proper patient subset. The present results also suggest that the dynamic nature of immune responses should be considered in survival prediction in sepsis. Finally, further studies are required to assess the efficacy of early and long-term vitamin C in selected patients with sepsis, using a well-defined control group.
KEY MESSAGES
▪ Clustering analysis identified two subphenotypes of inflammatory immune responses in septic patients receiving vitamin C, hydrocortisone, and thiamine.
▪ Group 1 involved sustained levels of interleukin (IL)-6, tumor necrosis factor-α, and IL-10, while group 2 involved higher initial levels of these cytokines that rapidly declined thereafter.
▪ Group 2 demonstrated a better clinical course and lower intensive care unit mortality, and inclusion in group 2 was independently associated with a lower risk of 60-day mortality.
NOTES
-
CONFLICT OF INTEREST
No potential conflict of interest relevant to this article was reported.
-
FUNDING
This research was supported by the National Research Foundation of Korea grant funded by the Korea government (Ministry of Science, ICT & Future Planning) (2019R1G1A1099373). The funders had no role in the design and conduct of the study; collection, management, analysis, and interpretation of the data; preparation, review, or approval of the manuscript; or decision to submit the manuscript for publication.
-
AUTHOR CONTRIBUTIONS
Conceptualization: WYK. Data curation: MSB. Formal analysis: SHY, SYJ. Funding acquisition: WYK. Methodology: WYK. Project administration: WYK. Visualization: WYK, OJK. Writing–original draft: WYK, SHY. Writing–review & editing: OJK, SYJ, MSB.
Acknowledgments
None.
SUPPLEMENTARY MATERIALS
Supplementary materials can be found via https://doi.org/10.4266/acc.2023.00507.
Supplementary Figure 1.
Violin plots of pooled time from shock onset to vitamin C protocol administration in intensive care unit survivors and non-survivors. The center lines indicate the median values, the box tops and bottoms indicate the interquartile ranges, error bars indicate the overall ranges, and the dots indicate outliers.
acc-2023-00507-Supplementary-Fig-1.pdf
Supplementary Figure 2.
Mean changes in (A) vasopressor dose (norepinephrine equivalent) and (B) Sequential Organ Failure Assessment (SOFA) score in intensive care unit survivors and non-survivors during the study period. Norepi eq: norepinephrine equivalent. a)P<0.01, b)P<0.001 when survivors and non-survivors were compared using the Mann-Whitney U-test.
acc-2023-00507-Supplementary-Fig-2.pdf
Supplementary Figure 3.
Mean changes in (A) lymphocyte count, (B) C-reactive protein, (C) interleukin (IL)-6, (D) tumor necrosis factor (TNF)-α, and (E) IL-10 levels in intensive care unit survivors and non-survivors during the study period. a)P<0.05, b)P<0.01, c)P<0.001 when survivors and non-survivors were compared using the Mann-Whitney U-test.
acc-2023-00507-Supplementary-Fig-3.pdf
Supplementary Figure 4.
Mean changes in (A) lymphocyte count, (B) C-reactive protein, (C) interleukin (IL)-6, (D) tumor necrosis factor (TNF)-α, and (E) IL-10 levels in immunocompetent and immunocompromised patients during the study period.
acc-2023-00507-Supplementary-Fig-4.pdf
Supplementary Figure 5.
Violin plots of pooled time from shock onset to vitamin C protocol administration by group. The center lines indicate the median values, the box tops and bottoms indicate the interquartile ranges, error bars indicate the overall ranges, and the dots indicate outliers.
acc-2023-00507-Supplementary-Fig-5.pdf
Supplementary Figure 6.
Cox regression survival curves by group. The data are adjusted for immunosuppression, nosocomial infection, Acute Physiology and Chronic Health Evaluation (APACHE) II score, Sequential Organ Failure Assessment (SOFA) score, mechanical ventilation, renal replacement therapy, hydrocortisone duration, and interleukin-10. CI: confidence interval.
acc-2023-00507-Supplementary-Fig-6.pdf
Figure 1.Patient inclusion flowchart. ICU: intensive care unit.

Figure 2.Clustering of inflammatory responses in septic patients receiving the vitamin C protocol. Group-based multi-trajectory modeling reveals two subphenotypes of inflammatory immune responses (group 1, 41 patients; group 2, 54 patients). The mean changes in (A) lymphocyte counts, (B) C-reactive protein levels, (C) Interleukin (IL)-6 levels, (D) tumor necrosis factor (TNF)-α levels, and (E) IL-10 levels in groups 1 and 2 during the study period.
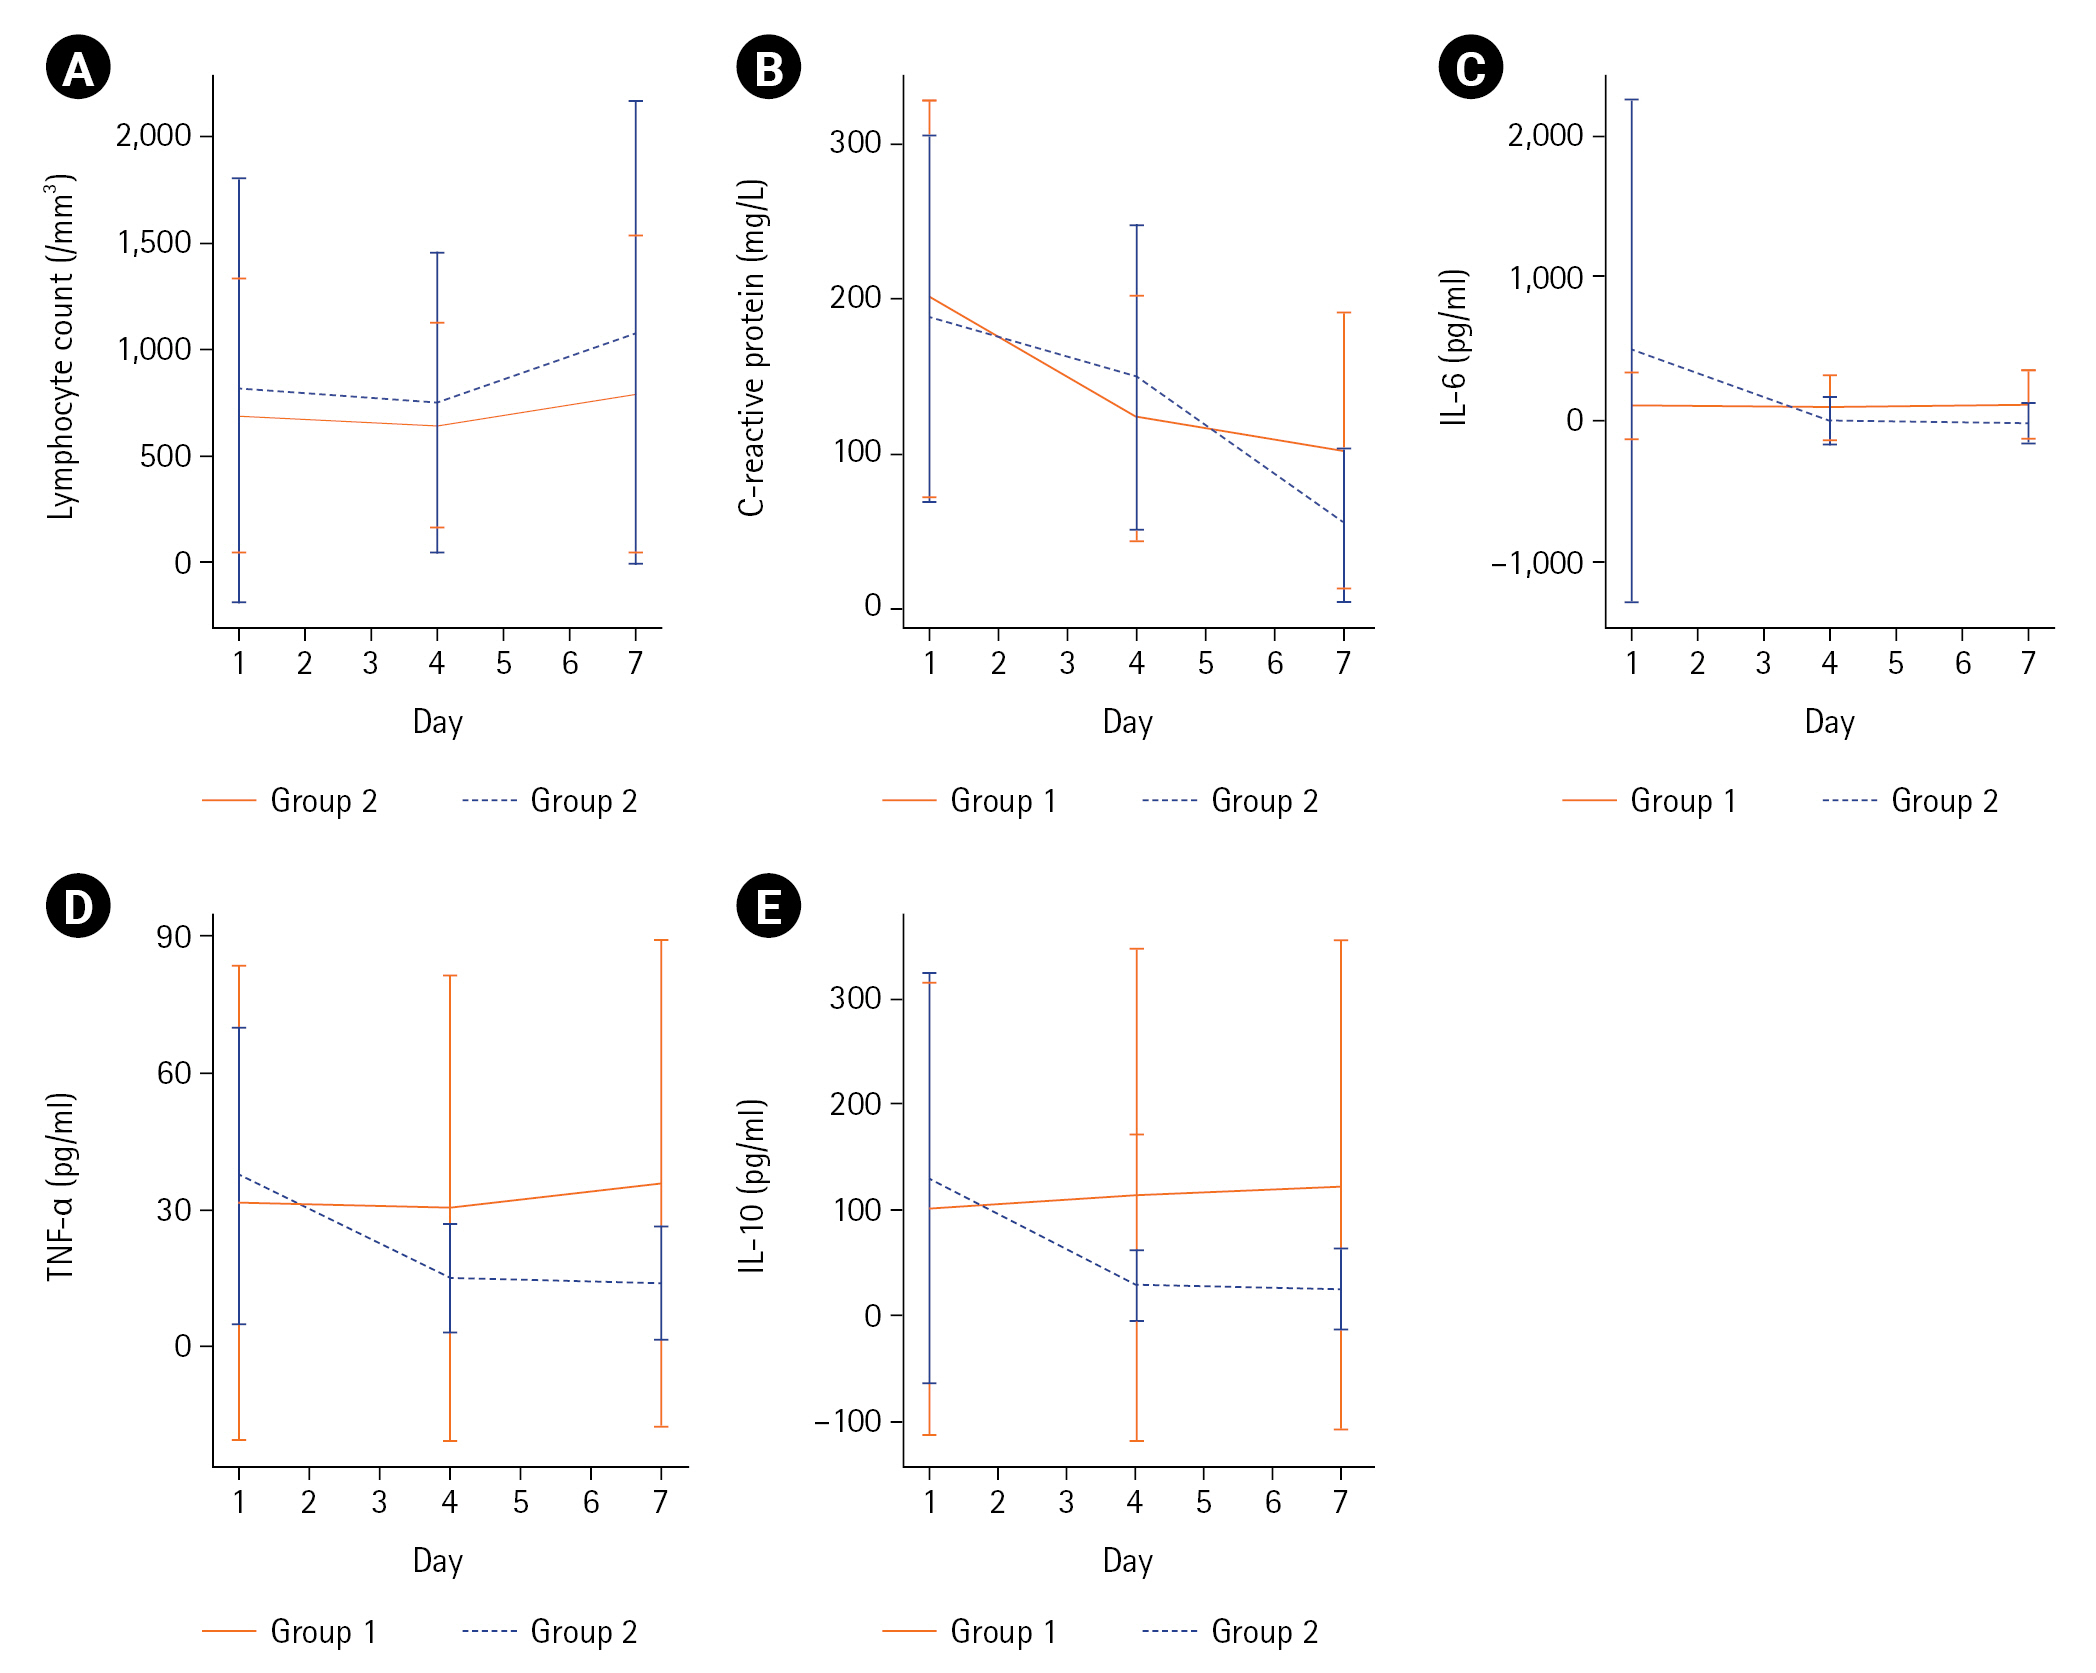
Figure 3.Mean changes in (A) vasopressor dose (norepinephrine equivalent) and (B) Sequential Organ Failure Assessment (SOFA) score by group during the study period. a)P<0.05, b)P<0.01 when group 1 and group 2 are compared using the Mann-Whitney U-test.
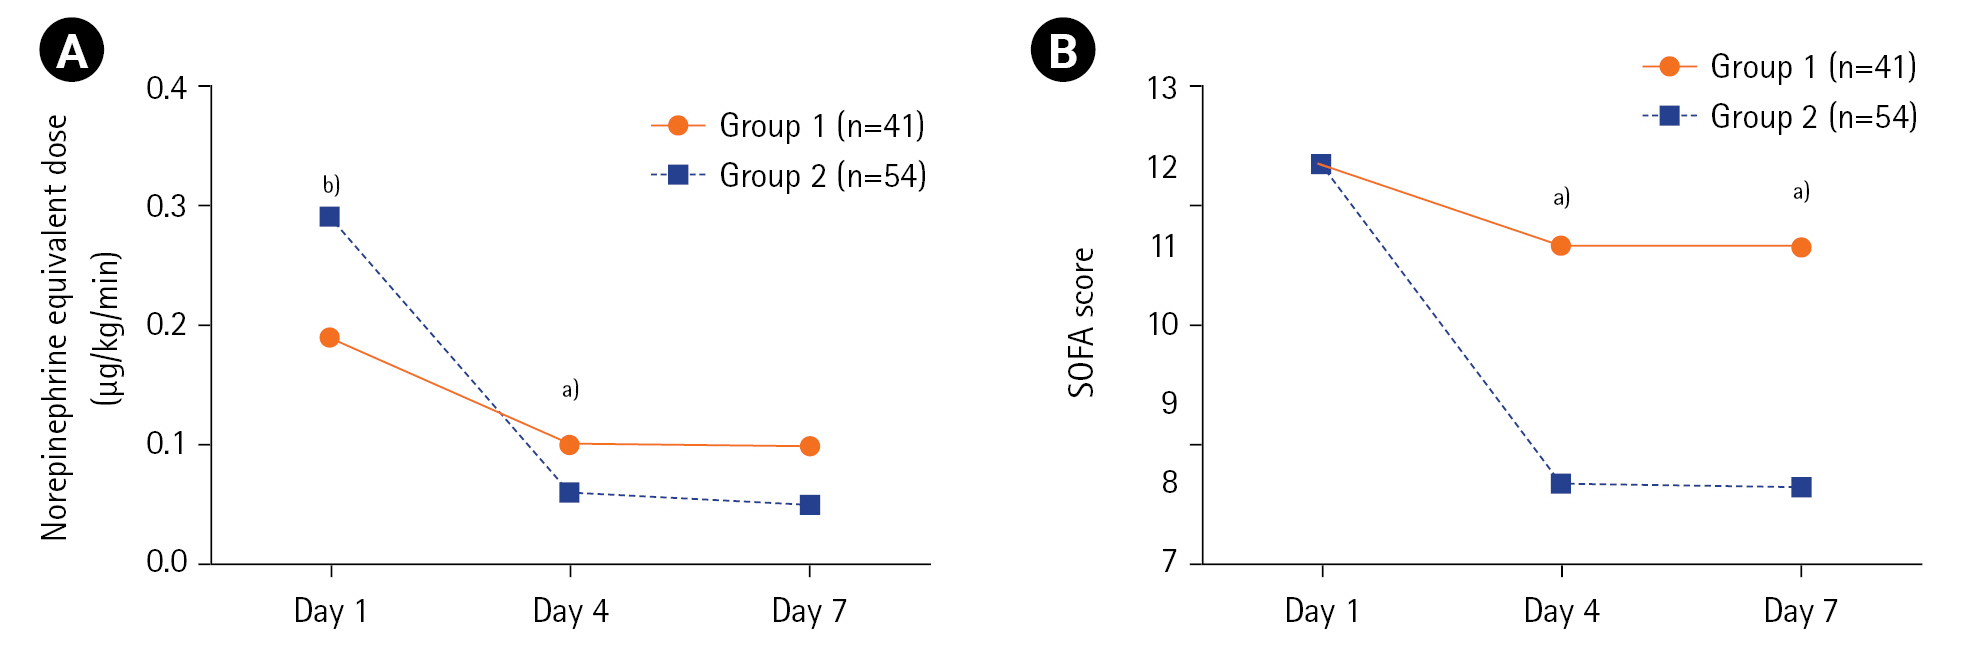
Table 1.BIC and AIC values and predicted group proportions from GBMTM
|
Group |
BIC |
AIC |
Patients in each predicted group (%)
|
|
1 |
2 |
3 |
4 |
5 |
6 |
7 |
|
2 |
–1,786.28 |
–1,731.37 |
43.2 |
56.8 |
|
|
|
|
|
|
3 |
–1,787.18 |
–1,708.01 |
22.1 |
60.0 |
17.9 |
|
|
|
|
|
4 |
–1,872.80 |
–1,769.37 |
0 |
43.2 |
56.8 |
0 |
|
|
|
|
5 |
–1,916.07 |
–1,788.37 |
0 |
43.2 |
0 |
56.8 |
0 |
|
|
|
6 |
–1,849.98 |
–1,698.02 |
0 |
8.4 |
29.5 |
48.4 |
13.7 |
0 |
|
|
7 |
–1,893.24 |
–1,717.02 |
0 |
8.4 |
29.5 |
0 |
48.4 |
13.7 |
0 |
Table 2.Baseline patient characteristics by group
|
Characteristics |
Group 1 (n=41) |
Group 2 (n=54) |
P-value |
|
Age (yr) |
75 (70–84) |
78 (68–84) |
0.94 |
|
Sex |
|
|
0.72 |
|
Male |
22 (54) |
31 (57) |
|
|
Female |
19 (46) |
23 (43) |
|
|
Body mass index (kg/m2) |
21.3 (18.5–23.5) |
21.2 (18.1–24.2) |
0.93 |
|
Comorbidity |
|
|
|
|
Diabetes |
14 (34) |
26 (48) |
0.17 |
|
Hypertension |
25 (61) |
34 (63) |
0.84 |
|
Chronic heart failure |
5 (12) |
4 (7) |
0.49 |
|
Chronic lung disease |
7 (17) |
15 (28) |
0.22 |
|
Liver cirrhosis |
4 (10) |
3 (6) |
0.46 |
|
Chronic kidney disease |
6 (15) |
9 (17) |
0.79 |
|
Immunosuppressiona)
|
15 (37) |
8 (15) |
0.01 |
|
Nosocomial infection |
17 (42) |
16 (30) |
0.23 |
|
Cause of sepsis |
|
|
|
|
Pneumonia |
25 (61) |
29 (54) |
0.48 |
|
Urosepsis |
7 (17) |
13 (24) |
0.41 |
|
Gastrointestinal/biliary |
8 (20) |
7 (13) |
0.39 |
|
Bacteremia |
13 (32) |
22 (41) |
0.37 |
|
ARDS |
9 (22) |
12 (22) |
0.98 |
|
APACHE II score |
28 (20–35) |
27 (20–33) |
0.47 |
|
SOFA score |
12±3 |
12±3 |
0.49 |
|
Antibiotics |
41 (100) |
54 (100) |
- |
|
Mechanical ventilation |
29 (71) |
37 (69) |
0.82 |
|
Renal replacement therapy |
13 (32) |
22 (41) |
0.37 |
|
Vital signs and laboratory data |
|
|
|
|
Body temperature (°C) |
36.9 (36.5–37.6) |
37.1 (36.6–37.6) |
0.54 |
|
Mean arterial pressure (mm Hg) |
59 (52–65) |
62 (54–66) |
0.26 |
|
Respiratory rate (breaths/min) |
30 (26–32) |
28 (25–32) |
0.38 |
|
PaO2/FiO2
|
194 (113–281) |
179 (113–248) |
0.67 |
|
Bicarbonate (mEq/L) |
21.0 (18.3–23.6) |
21.7 (17.6–24.5) |
0.51 |
|
Creatinine (mg/dl) |
1.3 (0.9–1.9) |
1.3 (0.9–2.3) |
0.96 |
|
Lymphocyte count (/mm3) |
690±644 |
810±998 |
0.60 |
|
Total bilirubin (mg/dl) |
0.6 (0.5–1.3) |
0.9 (0.5–1.8) |
0.41 |
|
C-reactive protein (mg/L) |
200±128 |
188±119 |
0.67 |
|
Procalcitonin (ng/ml) |
2.4 (0.7–23.4) (n=38) |
5.8 (1.6–40.5) (n=52) |
0.06 |
|
Lactate (mmol/L) |
1.7 (1.3–3.0) |
2.7 (1.9–4.9) |
0.02 |
|
Norepinephrine equivalent dose (μg/kg/min) |
0.19±0.21 |
0.29±0.24 |
0.006 |
|
Duration (day) |
|
|
|
|
Vitamin C |
3.6±0.9 |
4.4±1.2 |
0.002 |
|
Hydrocortisone |
4.2±2.6 |
5.0±1.9 |
0.004 |
|
Thiamine |
3.6±0.9 |
4.4±1.2 |
0.002 |
|
Time from shock onset to vitamin C protocol (hr) |
3 (1–6) |
1 (0–7) |
0.36 |
Table 3.Clinical outcomes by group
|
Outcomes |
Group 1 (n=41) |
Group 2 (n=54) |
P-value |
|
Mortality |
|
|
|
|
ICU |
16 (39.0) |
10 (18.5) |
0.03 |
|
28 Day |
20 (48.8) |
12 (22.2) |
0.007 |
|
60 Day |
20 (48.8) |
17 (31.5) |
0.09 |
|
Change in norepinephrine equivalent dose at day 4 (μg/kg/min) |
–0.09±0.16 |
–0.23±0.31 |
<0.001 |
|
Change in SOFA score at day 4 |
0±5 |
–4±3 |
0.002 |
|
Net fluid retention (ml)a)
|
|
|
|
|
Day 1 |
1,280 (696 to 2,791) |
1,118 (240 to 2,261) |
0.28 |
|
Day 4 |
180 (–338 to 1,053) (n=31) |
315 (–392 to 785) (n=54) |
0.62 |
|
Day 7 |
279 (–341 to 725) (n=28) |
160 (–769 to 850) (n=49) |
0.73 |
|
Vasopressor weaning |
31 (76) |
46 (85) |
0.24 |
|
Vasopressor-free day at day 28 |
26 (17 to 27) |
26 (22 to 27) |
0.55 |
|
Ventilator weaning |
14 (48) (n=29) |
24 (65) (n=37) |
0.18 |
|
Ventilator-free day at day 28 |
10±11 (n=29) |
13±11 (n=37) |
0.19 |
|
Length of stay (day) |
|
|
|
|
ICU |
6 (2 to 14) |
9 (5 to 18) |
0.03 |
|
Hospital |
22 (16 to 49) |
31 (17 to 50) |
0.07 |
|
Superinfection |
8 (20) |
14 (26) |
0.46 |
Table 4.Association between baseline characteristics and 60-day mortality
|
Characteristics |
Unadjusted HR (95% CI) |
P-value |
Adjusted HRa) (95% CI) |
P-value |
|
Age |
1.02 (0.99–1.05) |
0.28 |
|
|
|
Male |
0.91 (0.47–1.73) |
0.91 |
|
|
|
Body mass index |
0.97 (0.90–1.04) |
0.43 |
|
|
|
Diabetes |
0.93 (0.48–1.78) |
0.82 |
|
|
|
Hypertension |
1.02 (0.52–1.97) |
0.97 |
|
|
|
Chronic heart failure |
1.38 (0.49–3.89) |
0.55 |
|
|
|
Chronic lung disease |
1.10 (0.52–2.34) |
0.80 |
|
|
|
Liver cirrhosis |
1.11 (0.34–3.61) |
0.87 |
|
|
|
Chronic kidney disease |
0.73 (0.28–1.86) |
0.50 |
|
|
|
Immunosuppressionb) |
2.28 (1.16–4.49) |
0.02 |
1.03 (0.43–2.45) |
0.95 |
|
Nosocomial infection |
2.17 (1.14–4.15) |
0.02 |
1.51 (0.76–3.03) |
0.24 |
|
Pneumonia |
1.75 (0.88–3.48) |
0.11 |
|
|
|
Urosepsis |
0.53 (0.21–1.37) |
0.19 |
|
|
|
Gastrointestinal/biliary |
0.63 (0.22–1.77) |
0.38 |
|
|
|
Bacteremia |
1.22 (0.63–2.36) |
0.55 |
|
|
|
ARDS |
1.78 (0.89–3.54) |
0.10 |
|
|
|
APACHE II score |
1.11 (1.06–1.16) |
<0.001 |
1.09 (1.04–1.14) |
<0.001 |
|
SOFA score |
1.23 (1.09–1.39) |
0.001 |
1.06 (0.90–1.25) |
0.51 |
|
Mechanical ventilation |
4.52 (1.60–12.79) |
0.004 |
1.30 (0.35–4.78) |
0.69 |
|
Renal replacement therapy |
2.73 (1.42–5.22) |
0.002 |
2.02 (0.96–4.24) |
0.06 |
|
Lymphocyte count |
1.00 (1.00–1.00) |
0.55 |
|
|
|
C-reactive protein |
1.00 (1.00–1.00) |
0.85 |
|
|
|
Lactate |
1.08 (0.96–1.21) |
0.19 |
|
|
|
Norepinephrine equivalent dose |
0.34 (0.06–1.88) |
0.22 |
|
|
|
Vitamin C duration |
0.83 (0.60–1.14) |
0.24 |
|
|
|
Thiamine duration |
0.83 (0.60–1.14) |
0.24 |
|
|
|
Hydrocortisone duration |
1.17 (1.03–1.34) |
0.02 |
1.14 (1.01–1.30) |
0.04 |
|
Time from shock onset to vitamin C protocol |
1.01 (0.96–1.05) |
0.77 |
|
|
|
IL-6 |
1.00 (1.00–1.00) |
0.73 |
|
|
|
TNF-α |
1.01 (0.00–1.01) |
0.16 |
|
|
|
IL-10 |
1.00 (1.00–1.00) |
0.04 |
1.00 (1.00–1.00) |
0.17 |
|
Group 2 |
0.48 (0.25–0.92) |
0.03 |
0.32 (0.16–0.64) |
0.001 |
References
- 1. Singer M, Deutschman CS, Seymour CW, Shankar-Hari M, Annane D, Bauer M, et al. The third international consensus definitions for sepsis and septic shock (Sepsis-3). JAMA 2016;315:801-10.ArticlePubMedPMC
- 2. Rudd KE, Johnson SC, Agesa KM, Shackelford KA, Tsoi D, Kievlan DR, et al. Global, regional, and national sepsis incidence and mortality, 1990-2017: analysis for the Global Burden of Disease Study. Lancet 2020;395:200-11.ArticlePubMedPMC
- 3. Gotts JE, Matthay MA. Sepsis: pathophysiology and clinical management. BMJ 2016;353:i1585. ArticlePubMed
- 4. Laterre PF, Pickkers P, Marx G, Wittebole X, Meziani F, Dugernier T, et al. Safety and tolerability of non-neutralizing adrenomedullin antibody adrecizumab (HAM8101) in septic shock patients: the AdrenOSS-2 phase 2a biomarker-guided trial. Intensive Care Med 2021;47:1284-94.ArticlePubMedPMCPDF
- 5. Kashiouris MG, L'Heureux M, Cable CA, Fisher BJ, Leichtle SW, Fowler AA. The emerging role of vitamin c as a treatment for sepsis. Nutrients 2020;12:292. ArticlePubMedPMC
- 6. Barabutis N, Khangoora V, Marik PE, Catravas JD. Hydrocortisone and ascorbic acid synergistically prevent and repair lipopolysaccharide-induced pulmonary endothelial barrier dysfunction. Chest 2017;152:954-62.ArticlePubMedPMC
- 7. Donnino MW, Carney E, Cocchi MN, Barbash I, Chase M, Joyce N, et al. Thiamine deficiency in critically ill patients with sepsis. J Crit Care 2010;25:576-81.ArticlePubMed
- 8. Assouline B, Faivre A, Verissimo T, Sangla F, Berchtold L, Giraud R, et al. Thiamine, ascorbic acid, and hydrocortisone as a metabolic resuscitation cocktail in sepsis: a meta-analysis of randomized controlled trials with trial sequential analysis. Crit Care Med 2021;49:2112-20.ArticlePubMed
- 9. Sato R, Hasegawa D, Prasitlumkum N, Ueoka M, Nishida K, Takahashi K, et al. Effect of IV high-dose vitamin C on mortality in patients with sepsis: a systematic review and meta-analysis of randomized controlled trials. Crit Care Med 2021;49:2121-30.ArticlePubMed
- 10. Lamontagne F, Masse MH, Menard J, Sprague S, Pinto R, Heyland DK, et al. Intravenous vitamin C in adults with sepsis in the intensive care unit. N Engl J Med 2022;386:2387-98.ArticlePubMed
- 11. Iglesias J, Vassallo AV, Liesenfeld O, Levine JS, Patel VV, Sullivan JB, et al. A 33-mRNA classifier is able to produce inflammopathic, adaptive, and coagulopathic endotypes with prognostic significance: the outcomes of metabolic resuscitation using ascorbic acid, thiamine, and glucocorticoids in the early treatment of sepsis (ORANGES) trial. J Pers Med 2020;11:9. ArticlePubMedPMC
- 12. Kim WY, Jung JW, Choi JC, Shin JW, Kim JY. Subphenotypes in patients with septic shock receiving vitamin C, hydrocortisone, and thiamine: a retrospective cohort analysis. Nutrients 2019;11:2976. ArticlePubMedPMC
- 13. Rhodes A, Evans LE, Alhazzani W, Levy MM, Antonelli M, Ferrer R, et al. Surviving sepsis campaign: international guidelines for management of sepsis and septic shock: 2016. Intensive Care Med 2017;43:304-77.PubMed
- 14. Knaus WA, Draper EA, Wagner DP, Zimmerman JE. APACHE II: a severity of disease classification system. Crit Care Med 1985;13:818-29.ArticlePubMed
- 15. Vincent JL, Moreno R, Takala J, Willatts S, De Mendonça A, Bruining H, et al. The SOFA (Sepsis-related Organ Failure Assessment) score to describe organ dysfunction/failure. On behalf of the Working Group on Sepsis-Related Problems of the European Society of Intensive Care Medicine. Intensive Care Med 1996;22:707-10.ArticlePubMedPDF
- 16. Khanna A, English SW, Wang XS, Ham K, Tumlin J, Szerlip H, et al. Angiotensin II for the treatment of vasodilatory shock. N Engl J Med 2017;377:419-30.ArticlePubMed
- 17. ARDS Definition Task Force; Ranieri VM, Rubenfeld GD, Thompson BT, Ferguson ND, Caldwell E, et al. Acute respiratory distress syndrome: the Berlin Definition. JAMA 2012;307:2526-33.PubMed
- 18. de Grooth HJ, Elbers PWG, Vincent JL. Vitamin C for sepsis and acute respiratory failure. JAMA 2020;323:792. Article
- 19. Nagin DS, Jones BL, Passos VL, Tremblay RE. Group-based multi-trajectory modeling. Stat Methods Med Res 2018;27:2015-23.ArticlePubMedPDF
- 20. Magrini A. Assessment of agricultural sustainability in European Union countries: a group-based multivariate trajectory approach. AStA Adv Stat Anal 2022;106:673-703.ArticlePDF
- 21. Calfee CS, Delucchi K, Parsons PE, Thompson BT, Ware LB, Matthay MA, et al. Subphenotypes in acute respiratory distress syndrome: latent class analysis of data from two randomised controlled trials. Lancet Respir Med 2014;2:611-20.ArticlePubMedPMC
- 22. Calfee CS, Delucchi KL, Sinha P, Matthay MA, Hackett J, Shankar-Hari M, et al. Acute respiratory distress syndrome subphenotypes and differential response to simvastatin: secondary analysis of a randomised controlled trial. Lancet Respir Med 2018;6:691-8.PubMedPMC
- 23. Antcliffe DB, Burnham KL, Al-Beidh F, Santhakumaran S, Brett SJ, Hinds CJ, et al. Transcriptomic signatures in sepsis and a differential response to steroids. from the VANISH Randomized Trial. Am J Respir Crit Care Med 2019;199:980-6.ArticlePubMedPMC
- 24. Fowler AA 3rd, Syed AA, Knowlson S, Sculthorpe R, Farthing D, DeWilde C, et al. Phase I safety trial of intravenous ascorbic acid in patients with severe sepsis. J Transl Med 2014;12:32. ArticlePubMedPMCPDF
- 25. Zhang J, Rao X, Li Y, Zhu Y, Liu F, Guo G, et al. Pilot trial of high-dose vitamin C in critically ill COVID-19 patients. Ann Intensive Care 2021;11:5. ArticlePubMedPMCPDF
- 26. Bhavani SV, Carey KA, Gilbert ER, Afshar M, Verhoef PA, Churpek MM. Identifying novel sepsis subphenotypes using temperature trajectories. Am J Respir Crit Care Med 2019;200:327-35.ArticlePubMedPMC
- 27. Kellum JA, Pike F, Yealy DM, Huang DT, Shapiro NI, Angus DC, et al. Relationship between alternative resuscitation strategies, host response and injury biomarkers, and outcome in septic shock: analysis of the protocol-based care for early septic shock study. Crit Care Med 2017;45:438-45.ArticlePubMedPMC
- 28. Kang S, Tanaka T, Narazaki M, Kishimoto T. Targeting interleukin-6 signaling in clinic. Immunity 2019;50:1007-23.ArticlePubMed
- 29. Stanic B, van de Veen W, Wirz OF, Rückert B, Morita H, Söllner S, et al. IL-10-overexpressing B cells regulate innate and adaptive immune responses. J Allergy Clin Immunol 2015;135:771-80.ArticlePubMed
- 30. Matsumoto H, Ogura H, Shimizu K, Ikeda M, Hirose T, Matsuura H, et al. The clinical importance of a cytokine network in the acute phase of sepsis. Sci Rep 2018;8:13995. ArticlePubMedPMCPDF
- 31. Weidhase L, Wellhöfer D, Schulze G, Kaiser T, Drogies T, Wurst U, et al. Is Interleukin-6 a better predictor of successful antibiotic therapy than procalcitonin and C-reactive protein?: a single center study in critically ill adults. BMC Infect Dis 2019;19:150. ArticlePubMedPMCPDF
- 32. Härtel C, Strunk T, Bucsky P, Schultz C. Effects of vitamin C on intracytoplasmic cytokine production in human whole blood monocytes and lymphocytes. Cytokine 2004;27:101-6.ArticlePubMed
- 33. van der Poll T, van de Veerdonk FL, Scicluna BP, Netea MG. The immunopathology of sepsis and potential therapeutic targets. Nat Rev Immunol 2017;17:407-20.ArticlePubMedPDF
- 34. Black S, Kushner I, Samols D. C-reactive Protein. J Biol Chem 2004;279:48487-90.ArticlePubMed
- 35. Nakamura K, Ogura K, Nakano H, Naraba H, Takahashi Y, Sonoo T, et al. C-reactive protein clustering to clarify persistent inflammation, immunosuppression and catabolism syndrome. Intensive Care Med 2020;46:437-43.ArticlePubMedPDF
- 36. Frommelt MA, Kory P, Long MT. Letter on Update to the vitamin C, thiamine, and steroids in sepsis (VICTAS) protocol. Trials 2020;21:350. ArticlePubMedPMCPDF
- 37. Jung SY, Lee MT, Baek MS, Kim WY. Vitamin C for ≥ 5 days is associated with decreased hospital mortality in sepsis subgroups: a nationwide cohort study. Crit Care 2022;26:3. ArticlePubMedPMCPDF
Citations
Citations to this article as recorded by

- Micronutrients as therapy in critical illness
Christian Stoppe, Ellen Dresen, Angelique de Man
Current Opinion in Critical Care.2024; 30(2): 178. CrossRef

 , Oh Joo Kweon2

 PubReader
 ePub Link
 Cite
Cite


