Skip Navigation
Skip to contents

ACC : Acute and Critical Care

OPEN ACCESS
SEARCH
Search

Articles

Page Path
HOME > Acute Crit Care > Volume 39(1); 2024 > Article
Original Article
Trauma
The correlation between carotid artery Doppler and stroke volume during central blood volume loss and resuscitation
Isabel Kerrebijn1orcid, Sarah Atwi1orcid, Mai Elfarnawany1orcid, Andrew M. Eibl1,2, Joseph K. Eibl1,2,3orcid, Jenna L. Taylor4,5orcid, Chul-Ho Kim4, Bruce D. Johnson4, Jon-Émile S. Kenny1,2orcid
Acute and Critical Care 2024;39(1):162-168.
DOI: https://doi.org/10.4266/acc.2023.01095
Published online: February 23, 2024

1Flosonics Medical, Toronto, ON, Canada

2Health Sciences North Research Institute, Sudbury, ON, Canada

3Northern Ontario School of Medicine University, Sudbury, ON, Canada

4Human Integrative and Environmental Physiology Laboratory, Department of Cardiovascular Diseases, Mayo Clinic, Rochester, MN, USA

5Physiology and Ultrasound Laboratory in Science and Exercise, School of Human Movement and Nutrition Sciences, The University of Queensland, Brisbane, Australia

Corresponding author: Jon-Émile S. Kenny Flosonics Medical, 325 W. Front St, Toronto, ON M5V2Y1, Canada Tel: +1-705-523-7100 Email: jon-emile@heart-lung.org
• Received: August 23, 2023   • Revised: December 14, 2023   • Accepted: January 23, 2024

© 2024 The Korean Society of Critical Care Medicine

This is an Open Access article distributed under the terms of the Creative Commons Attribution Non-Commercial License (http://creativecommons.org/licenses/by-nc/4.0/) which permits unrestricted non-commercial use, distribution, and reproduction in any medium, provided the original work is properly cited.

  • 496 Views
  • 38 Download
  • Background
    Using peripheral arteries to infer central hemodynamics is common among hemodynamic monitors. Doppler ultrasound of the common carotid artery has been used in this manner with conflicting results. We investigated the relationship between changing common carotid artery Doppler measures and stroke volume (SV), hypothesizing that more consecutively-averaged cardiac cycles would improve SV-carotid Doppler correlation.
  • Methods
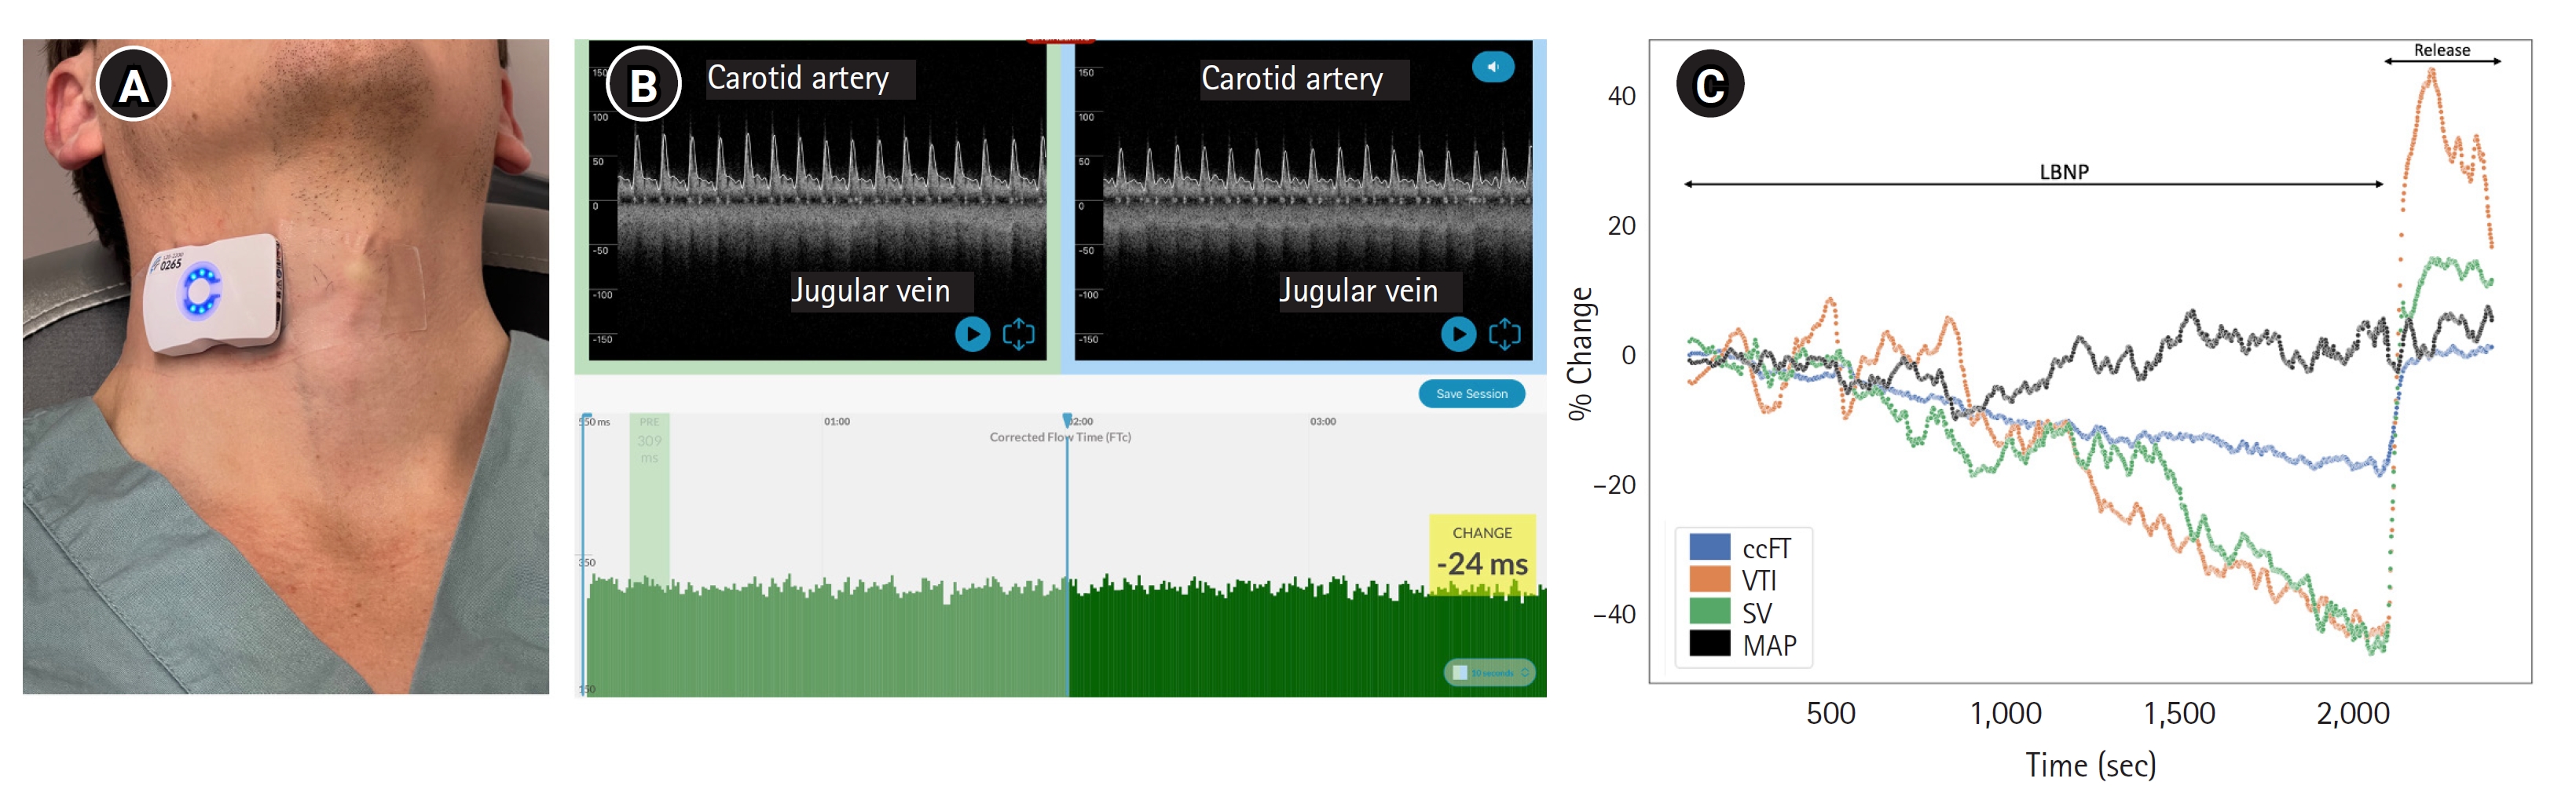
    Twenty-seven healthy volunteers were recruited and studied in a physiology laboratory. Carotid artery Doppler pulse was measured with a wearable, wireless ultrasound during central hypovolemia and resuscitation induced by a stepped lower body negative pressure protocol. The change in maximum velocity time integral (VTI) and corrected flow time of the carotid artery (ccFT) were compared with changing SV using repeated measures correlation.
  • Results
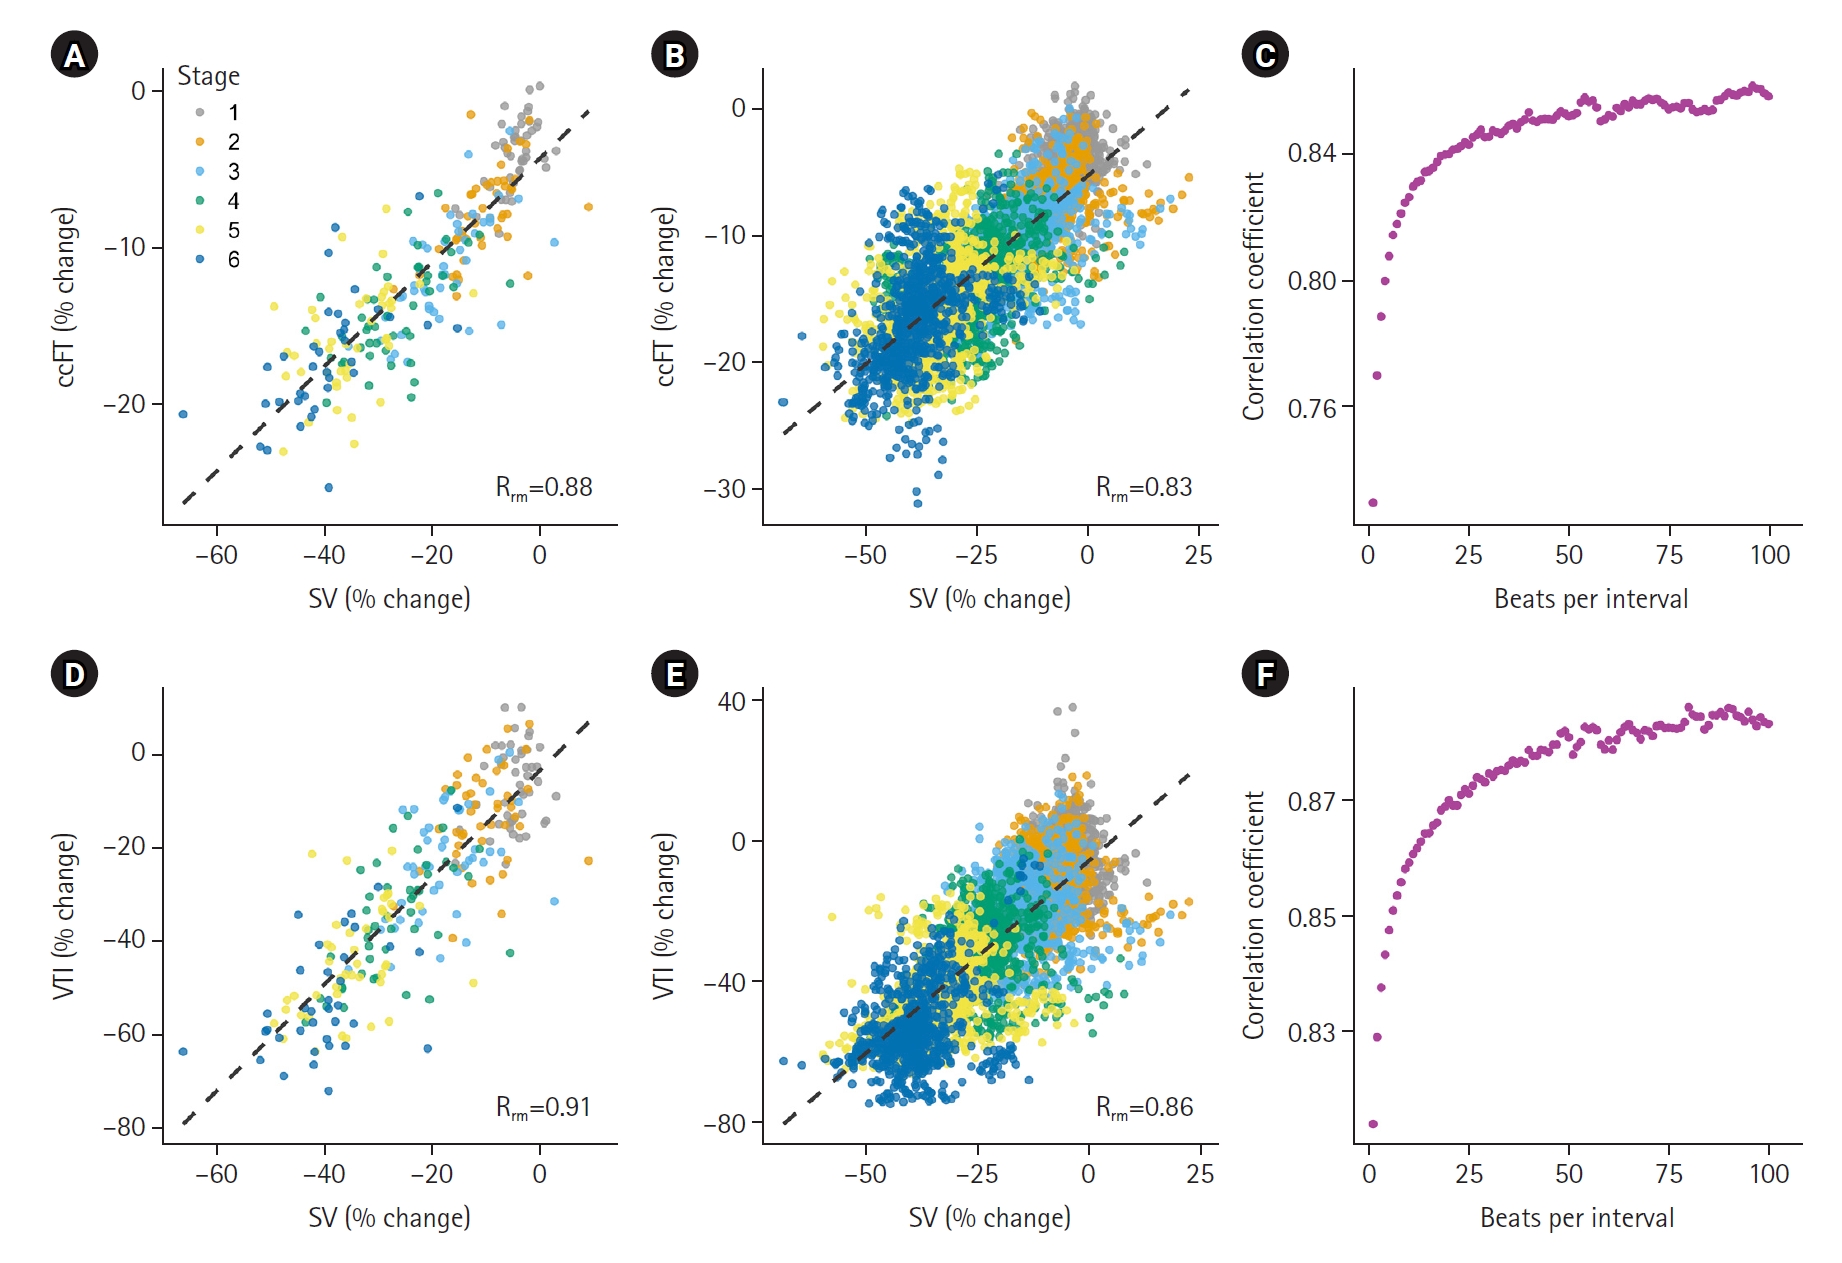
    In total, 73,431 cardiac cycles were compared across 27 subjects. There was a strong linear correlation between changing SV and carotid Doppler measures during simulated hemorrhage (repeated-measures linear correlation [Rrm]=0.91 for VTI; 0.88 for ccFT). This relationship improved with larger numbers of consecutively-averaged cardiac cycles. For ccFT, beyond four consecutively-averaged cardiac cycles the correlation coefficient remained strong (i.e., Rrm of at least 0.80). For VTI, the correlation coefficient with SV was strong for any number of averaged cardiac cycles. For both ccFT and VTI, Rrm remained stable around 25 consecutively-averaged cardiac cycles.
  • Conclusions
    There was a strong linear correlation between changing SV and carotid Doppler measures during central blood volume loss. The strength of this relationship was dependent upon the number of consecutively-averaged cardiac cycles.
Using a peripheral artery to transduce central hemodynamics is common among hemodynamic monitors. For instance, both calibrated and uncalibrated pulse contour analyses use the radial artery pressure waveform to infer volumetric flow from the left ventricle [1]. With the rise of point-of-care ultrasound use in acute care, a similar approach has been adopted with ultrasonographic measures. As an example, the common carotid artery Doppler pulse is used to assess both absolute [2,3] and changing [4-11] stroke volume (SV). With respect to the critically ill population, this approach is important during resuscitation as flow-guided preload administration reduces morbidity and mortality [12,13]; furthermore, detecting diminished SV could help diagnose early hemorrhage [14]. Nevertheless, there are conflicting results regarding carotid Doppler as an estimate of cardiac output and its change [15-17]. Various groups [18,19] have noted the importance of human measurement variability and cardiac cycle sample size as key mediators relating left ventricular output to the common carotid artery. Given this, Kenny et al. [4,18,20] previously reported on a wearable, wireless, adhesive Doppler ultrasound during central blood volume loss and resuscitation in healthy volunteers undergoing lower body negative pressure (LBNP) and release. Within this paradigm, this group showed that SV change across many cardiac cycles can be transduced by the carotid artery Doppler spectrogram. Therefore, we hypothesized that the correlation coefficient between changing SV and carotid Doppler measures such as the velocity time integral (VTI) and corrected flow time (ccFT) would depend on the number of consecutively-averaged cardiac cycles used to calculate change. Furthermore, we hypothesized that the relationship between the number of consecutively-averaged cardiac cycles and the correlation coefficient relating SV to carotid Doppler would be different between periods of falling SV (i.e., LBNP) and rising SV (i.e., LBNP release).
Ethics Approval and Consent to Participate
All data collection was initially performed after approval of the local Institutional Ethics Committee (No. 19-010136). Written informed consent was obtained from all participants included in the analysis at the time of enrollment. Adults with no prior medical history and taking no cardiovascular medications were recruited.
SV Monitoring
A non-invasive SV monitor, the Nexfin (Edwards Lifesciences), was used throughout the study and synchronized with the carotid Doppler monitor for each cardiac cycle. Alignment of the Doppler spectrograms to the non-invasive SV monitor was performed by cross-correlating heart rate (HR) to find the optimal lag in the Doppler signal. Systolic, diastolic and mean arterial pressure were also obtained from the Nexfin.
Doppler System
The U.S. Food and Drug Administration-cleared, wireless, wearable, four MHz Doppler ultrasound patch (Flosonics Medical) was placed and the ccFT and VTI captured, as described previously [4,18,20].
Lower Body Negative Pressure
Beginning with resting baseline, each stage of the LBNP protocol required five minutes. LBNP was reduced by 15 mm Hg per stage down to and including –60 mm Hg and then by 10 mm Hg down to and including –80 mm Hg if this was tolerated by the patient. The final stage was release of LBNP to atmospheric pressure. All subjects underwent this seven-stage protocol in duplicate.
Statistical Analysis
Cardiac cycles with artifact or during LBNP stage transition were excluded. Artifact was detected by HR discordance of < 0.8 or > 1.3-fold change between devices and visual inspection of the Doppler spectrograms for phonation or deglutition signatures. Both ccFT and VTI were referenced to resting baseline to model increasingly severe hypovolemia. Change from the lowest-achieved LBNP stage back to atmosphere modeled rapid blood transfusion.
To account for multiple measurements per person, repeated-measures linear correlation (Rrm) was performed across negative pressure stages. Spearman correlation was used to model lowest pressure stage back to release when using whole stage averages. To detect a Rrm of 0.8, with a power of 0.8 and significance level of 0.05, we calculated the minimum sample size for a multilevel model with seven stages. The minimum required sample size for each stage was approximately 11.
The baseline characteristics and vital signs of all included subjects are listed in Table 1. Healthy volunteers were recruited between July 2020 and December 2021 for this physiology laboratory study. In total, data from 27 subjects were included in this analysis. The wearable ultrasound patch, its graphical user interface and representative results from a single session are shown in Figure 1. Across all sessions and subjects, a total of 91,975 cardiac cycles were captured; but 20.16% of the beats were excluded for these reasons: 8.34% stage transition, 1.86% misaligned HR between the Doppler and traditional HR vital sign monitor (i.e., < 0.8 or > 1.3-fold change as compared to vital sign monitor), 6.86% Doppler feature detection (e.g., dicrotic notch) failure as determined by either ccFT or VTI value more than two standard deviations as compared to the respective mean values for any given LBNP stage, and 3.10% Nexfin feature detection failure as determined by SV value more than two standard deviations as compared to the mean value of any given LBNP stage. Stage transition was excluded to ensure hemodynamic stability during comparison between SV and carotid Doppler measures. A total of 73,431 cardiac cycles comprised the analysis and included 8,655 release-stage beats.
The correlations between changing ccFT and VTI against SV are shown in Figure 2. In Figure 2, the first row (Figure 2A-C) is % change ccFT, the second row (Figure 2D-F) is % change in carotid VTI. The first two panels for each row illustrate the relationship (i.e., repeated measures correlation) between % change SV on the X-axis and carotid Doppler change on the Y-axis during LBNP. The final panel in each row demonstrates the relationship between the number of consecutively-averaged cardiac cycles on the X-axis and strength of the repeated measures correlation coefficient on the Y-axis.
Our findings are important for the acute and critically ill populations. During progressive central blood volume loss, there was a strong, linear correlation between falling SV, ccFT and carotid VTI. Moreover, the correlation between changing ccFT and VTI with SV improved with increasing number of consecutively-averaged cardiac cycles in both the models of volume loss and resuscitation. Both ccFT and VTI also increased during central blood volume resuscitation, however the strength of their direct correlations with SV was less strong.
The finding that both VTI and ccFT correlated with falling SV during LBNP is consistent with previous work [4] and adds credence to measures such as the Doppler shock index, i.e., HR divided by ccFT or carotid artery VTI [14]. The slopes of the relationships found in this investigation imply that a 10% fall in SV correlates with a 11.8% fall in VTI and a 3.3% or 10.5 millisecond (ms) fall in ccFT. These values are consistent with previously-reported regression slopes between changing SV and carotid Doppler measures [4, 21]. Given that during exsanguination, the fraction of blood volume loss can be estimated as one-half of the % fall in SV, our measured VTI and ccFT values could be used as crude estimates of total blood volume loss. For example, 15% total blood volume loss is expected to decrease VTI by 35.4% and ccFT by 9.9% or 31.5 ms when hemorrhage is the sole etiology of reduced SV. Therefore, trending carotid artery Doppler measures in the acute trauma population could predict impending hemodynamic collapse due to blood loss prior to more traditional vital signs such as mean arterial pressure and HR [4,14,22].
Second, we observed stronger correlation between changing SV and carotid Doppler measures with greater numbers of consecutively-averaged cardiac cycles. While this is unsurprising, we note that for ccFT the relationship did not improve (i.e., above 0.8) until at least five cardiac cycles were averaged. In contrast, the relationship with VTI was strong with fewer cardiac cycles. We suspect that this is because of the precision required to infer SV change from the ccFT. For example, Barjaktarevic et al. [6] found that a +7 ms ccFT augmentation most accurately detected a +10% change in SV. In their cohort, the baseline ccFT was 301 ms; therefore, +7 ms approximates a +2% change in ccFT. These values are consistent with our reported findings; a 10% change in SV correlated with a 3% or 10.5 ms change in ccFT. Our observations have important implications for investigations relating cardiac output to the ccFT; averaging too few cardiac cycles will degrade the relationship [15]. The theoretical benefit of ccFT over carotid VTI is that ccFT is, ostensibly, more resistant to changes in carotid artery diameter, fraction of flow directed towards the head and error introduced by insonation angle selection [3,23,24].
Last, during the resuscitation phase of the LBNP model, the relationship between changing SV and carotid Doppler measures was less strong than during blood volume loss. We suspect that this is due to the relatively large change in SV between the final LBNP stage and recovery. Therefore, a more gradual rise in SV may have shown a stronger correlation. Additionally, the slope of the changing VTI to SV relationship was steeper during the release phase for VTI. The reason for this is not clear; however, increased carotid artery flow fraction at LBNP release could be the reason for this [3]. More specifically, a combination of increased peripheral resistance and downstream cerebrovascular dilation would preferentially direct flow to the carotid artery at the moment of LBNP release [3,20]; therefore, the rise in carotid VTI per unit SV augmentation would be greater.
There are limitations to our analysis. First, given that this was a convenience sample of healthy volunteers, these data may be difficult to generalize to patients in the hospital. Nevertheless, our observations are similar to a previous LBNP investigation [4], and carotid Doppler has been used to infer changes in SV in the critically-ill [6,25]. Second, the volunteers were cooperative and able to remain still for the entirety of the protocol; movement and vocalization by patients may make implementing this paradigm in the clinical sphere more challenging. Third, the release phase of our model was a relatively large preload bolus (i.e., immediately replenishing an approximate 25% central blood volume deficit [14]. A gradual increase in preload and, therefore, SV would clarify the relationship between carotid Doppler and central hemodynamics during the release phase.
In conclusion, this study comprised the largest known dataset comparing changing SV with the common carotid Doppler pulse. This investigation included 27 healthy subjects and 73,431 cardiac cycles, while most clinical studies sample fewer than three cardiac cycles per patient. There was a strong linear correlation between changing SV and ccFT as well as changing SV and VTI during central blood volume loss. Furthermore, the strength of this relationship was dependent upon the number of consecutively-averaged cardiac cycles. These results partly explain discordant outcomes when relating the carotid artery Doppler pulse to central hemodynamics.
▪ Inferring central hemodynamics from a peripheral artery is a common approach amongst hemodynamic monitors; however, many cardiac cycles are typically averaged with commercially-available devices.
▪ When changing carotid Doppler is compared to changing stroke volume measured by non-invasive pulse contour analysis, the correlation is strengthened when more cardiac cycles are averaged consecutively.
▪ There was a strong linear correlation between falling stroke volume and carotid artery Doppler pulse with progressively-severe central hypovolemia.
▪ This suggests monitoring carotid Doppler could help detect cryptic blood loss.

CONFLICT OF INTEREST

IK, SA, ME, AME, JKE, JESK are employees of Flosonics Medical. No other potential conflicts of interest relevant to this article were reported.

FUNDING

None.

AUTHOR CONTRIBUTIONS

Conceptualization: ME, AE, JKE, JLT, CHK, BDJ, JESK. Methodology: ME, AE, JKE, JLT, CHK, BDJ, JESK. Formal analysis: IK, SA. Data curation: IK, JLT. Visualization: IK, SA. Project administration: ME, AE, JKE, JESK. Funding acquisition: AE, JKE, JESK. Writing–original draft: IK, JESK. Writing–review & editing: all authors. All authors read and agreed to the published version of the manuscript.

ACKNOWLEDGMENTS

None.

Figure 1.
Wearable Doppler ultrasound and representative results. (A) The wearable Doppler ultrasound worn over the right common carotid artery of a healthy subject. (B) Representative Doppler spectrograms from left to right showing increasingly severe lower body negative pressure (LBNP). The green bars at the base are the common carotid corrected flow time (ccFT) per cardiac cycle and time on the X-axis. (C) Representative results from a single LBNP protocol showing two carotid ultrasound measures: ccFT and velocity time integral (VTI) compared to stroke volume (SV) and mean arterial pressure (MAP). Release was when the LBNP chamber returned to atmospheric pressure.
acc-2023-01095f1.jpg
Figure 2.
The relationship between change in common carotid artery corrected flow time (ccFT) and velocity time integral (VTI) with stroke volume (SV) in a model of central blood volume loss. (A) The relationship between SV % change from baseline and ccFT % change from baseline using whole stage averages. Across decreasing pressure stages, the repeated-measures linear correlation (Rrm) is 0.88 and the slope is 0.33. (B) The relationship between SV % change from baseline and ccFT % change from baseline using 10-beat averages. Across decreasing pressure stages, the Rrm is 0.83 and the slope is 0.30. (C) The effect of the number of consecutively-averaged cardiac cycles on repeated-measures correlation coefficient between % change SV and % change ccFT. (D) The relationship between SV % change from baseline and VTI % change from baseline using whole stage averages. Across decreasing pressure stages, the Rrm is 0.91 and the slope is 1.18. (E) The relationship between SV % change from baseline and VTI % change from baseline using 10-beat averages. Across decreasing pressure stages, the Rrm is 0.86 and the slope is 1.16. (F) The effect of the number of consecutively-averaged cardiac cycles on repeated-measures correlation coefficient between % change SV and % change VTI.
acc-2023-01095f2.jpg
Table 1.
Baseline characteristics
Variable Value (n=27)
Age (yr) 27±5
Female (%) 40.7
Body mass index (kg/m2) 25.3±4.1
Heart rate (bpm) 63.0±7.1
Systolic blood pressure (mm Hg) 130.3±12.1
Diastolic blood pressure (mm Hg) 78.4±6.3
Mean arterial pressure (mm Hg) 97.7±7.8

Values are presented as mean±standard deviation unless otherwise indicated.

  • 1. Teboul JL, Saugel B, Cecconi M, De Backer D, Hofer CK, Monnet X, et al. Less invasive hemodynamic monitoring in critically ill patients. Intensive Care Med 2016;42:1350-9.ArticlePubMedPDF
  • 2. Cheong I, Otero Castro V, Sosa FA, Tort Oribe B, Merlo PM, Tamagnone FM. Carotid flow as a surrogate of the left ventricular stroke volume. J Clin Monit Comput 2023;37:661-7.ArticlePubMedPDF
  • 3. Kenny JS. A theoretical foundation for relating the velocity time integrals of the left ventricular outflow tract and common carotid artery. J Clin Monit Comput 2023;37:937-9.ArticlePubMedPMCPDF
  • 4. Kenny JS, Barjaktarevic I, Mackenzie DC, Elfarnawany M, Yang Z, Eibl AM, et al. Carotid Doppler ultrasonography correlates with stroke volume in a human model of hypovolaemia and resuscitation: analysis of 48 570 cardiac cycles. Br J Anaesth 2021;127:e60-3.ArticlePubMed
  • 5. Kenny JS, Barjaktarevic I, Eibl AM, Parrotta M, Long BF, Elfarnawany M, et al. Temporal concordance between pulse contour analysis, bioreactance and carotid doppler during rapid preload changes. PLoS One 2022;17:e0265711. ArticlePubMedPMC
  • 6. Barjaktarevic I, Toppen WE, Hu S, Aquije Montoya E, Ong S, Buhr R, et al. Ultrasound assessment of the change in carotid corrected flow time in fluid responsiveness in undifferentiated shock. Crit Care Med 2018;46:e1040-6.ArticlePubMedPMC
  • 7. Marik PE, Levitov A, Young A, Andrews L. The use of bioreactance and carotid Doppler to determine volume responsiveness and blood flow redistribution following passive leg raising in hemodynamically unstable patients. Chest 2013;143:364-70.ArticlePubMed
  • 8. Effat H, Hamed K, Hamed G, Mostafa R, El Hadidy S. Electrical cardiometry versus carotid Doppler in assessment of fluid responsiveness in critically ill septic patients. Egypt J Crit Care Med 2021;8:96-113.
  • 9. Kimura A, Suehiro K, Juri T, Tanaka K, Mori T. Changes in corrected carotid flow time induced by recruitment maneuver predict fluid responsiveness in patients undergoing general anesthesia. J Clin Monit Comput 2022;36:1069-77.ArticlePubMedPDF
  • 10. Jung S, Kim J, Na S, Nam WS, Kim DH. Ability of carotid corrected flow time to predict fluid responsiveness in patients mechanically ventilated using low tidal volume after surgery. J Clin Med 2021;10:2676. ArticlePubMedPMC
  • 11. Cheong I, Otero Castro V, Sosa FA, Tort Oribe B, Fruchtenicht MF, Tamagnone FM, et al. Passive leg raising test using the carotid flow velocity-time integral to predict fluid responsiveness. J Ultrasound 2023 Sep 5 [Epub];https://doi.org/10.1007/s40477-023-00824-1.Article
  • 12. Douglas IS, Alapat PM, Corl KA, Exline MC, Forni LG, Holder AL, et al. Fluid response evaluation in sepsis hypotension and shock: a randomized clinical trial. Chest 2020;158:1431-45.ArticlePubMedPMC
  • 13. Dubin A, Loudet C, Kanoore Edul VS, Osatnik J, Ríos F, Vásquez D, et al. Characteristics of resuscitation, and association between use of dynamic tests of fluid responsiveness and outcomes in septic patients: results of a multicenter prospective cohort study in Argentina. Ann Intensive Care 2020;10:40. ArticlePubMedPMCPDF
  • 14. Kenny JS, Elfarnawany M, Yang Z, Eibl AM, Eibl JK, Kim CH, et al. A wireless ultrasound patch detects mild-to-moderate central hypovolemia during lower body negative pressure. J Trauma Acute Care Surg 2022;93(2S Suppl 1):S35-40.ArticlePubMedPMC
  • 15. Abbasi A, Azab N, Nayeemuddin M, Schick A, Lopardo T, Phillips GS, et al. Change in carotid blood flow and carotid corrected flow time assessed by novice sonologists fails to determine fluid responsiveness in spontaneously breathing intensive care unit patients. Ultrasound Med Biol 2020;46:2659-66.ArticlePubMedPMC
  • 16. van Houte J, Mooi FJ, Montenij LJ, Meijs LP, Suriani I, Conjaerts BC, et al. Correlation of carotid Doppler blood flow with invasive cardiac output measurements in cardiac surgery patients. J Cardiothorac Vasc Anesth 2022;36:1081-91.ArticlePubMed
  • 17. Khan S, Mishra SK, Parida S, Jha AK, Nagabhushanam Padala SR. Carotid doppler indices do not predict fluid responsiveness in mechanically ventilated patients undergoing coronary artery bypass grafting surgery. J Card Surg 2022;37:4418-24.ArticlePubMedPDF
  • 18. Kenny JS, Barjaktarevic I, Mackenzie DC, Elfarnawany M, Math ZY, Eibl AM, et al. Carotid Doppler measurement variability in functional hemodynamic monitoring: an analysis of 17,822 cardiac cycles. Crit Care Explor 2021;3:e0439. ArticlePubMedPMC
  • 19. Bussmann BM, Sharma S, Mcgregor D, Hulme W, Harris T. Observational study in healthy volunteers to define interobserver reliability of ultrasound haemodynamic monitoring techniques performed by trainee doctors. Eur J Emerg Med 2019;26:217-23.ArticlePubMed
  • 20. Kenny JS, Barjaktarevic I, Mackenzie DC, Elfarnawany M, Yang Z, Eibl AM, et al. Carotid artery velocity time integral and corrected flow time measured by a wearable Doppler ultrasound detect stroke volume rise from simulated hemorrhage to transfusion. BMC Res Notes 2022;15:7. ArticlePubMedPMCPDF
  • 21. Kerrebijn I, Atwi S, Horner C, Elfarnawany M, Eibl AM, Eibl JK, et al. Correlation between changing carotid artery corrected flow time and ascending aortic Doppler flow velocity. Br J Anaesth 2023;131:e192-5.ArticlePubMed
  • 22. Kenny JS, Elfarnawany M, Yang Z, Myers M, Eibl AM, Eibl JK, et al. The Doppler shock index measured by a wearable ultrasound patch accurately detects moderate-to-severe central hypovolemia during lower body negative pressure. J Am Coll Emerg Physicians Open 2021;2:e12533. ArticlePubMedPMCPDF
  • 23. Kenny JS, Cannesson M, Barjaktarevic I. Minimizing measurement variability in carotid ultrasound evaluations. J Ultrasound Med 2021;40:855-6.ArticlePubMedPMCPDF
  • 24. Kenny JS, Barjaktarevic I. Timing and measurement variability are critical when using carotid Doppler to infer hemodynamics. Ultrasound Med Biol 2020;46:3485-6.ArticlePubMed
  • 25. Beier L, Davis J, Esener D, Grant C, Fields JM. Carotid ultrasound to predict fluid responsiveness: a systematic review. J Ultrasound Med 2020;39:1965-76.PubMed

Figure & Data

References

    Citations

    Citations to this article as recorded by  

      • PubReader PubReader
      • ePub LinkePub Link
      • Cite
        CITE
        export Copy
        Close
        Download Citation
        Download a citation file in RIS format that can be imported by all major citation management software, including EndNote, ProCite, RefWorks, and Reference Manager.

        Format:
        • RIS — For EndNote, ProCite, RefWorks, and most other reference management software
        • BibTeX — For JabRef, BibDesk, and other BibTeX-specific software
        Include:
        • Citation for the content below
        The correlation between carotid artery Doppler and stroke volume during central blood volume loss and resuscitation
        Acute Crit Care. 2024;39(1):162-168.   Published online February 23, 2024
        Close
      • XML DownloadXML Download
      Figure
      We recommend

      ACC : Acute and Critical Care